QGIS
免費的GIS軟體,首先至官網下載。有多個版本可以選擇,先選擇Standalone installers (MSI) from OSGeo4W packages (recommended for new users)這個,聽說安裝比較簡單,目前版本Version 3.20。以後有機會再試試看Network Installer。下載完成後雙擊檔案安裝,原則上無腦next到底應該即可。有一點要注意的是QGIS已經不支援Win7,所以例如python scripting便不支援,所以作業系統應勿使用Win7,此處為使用Win10。安裝完成後,找到執行檔開啟。在上方menu bar找到View>Penals & Toolbars來設定快捷鍵的版面設計,以方便工作為準則。如下:

Basics
首先熟悉一下作業環境,先找到下圖位置打開世界地圖,雙擊或是拖曳皆可。
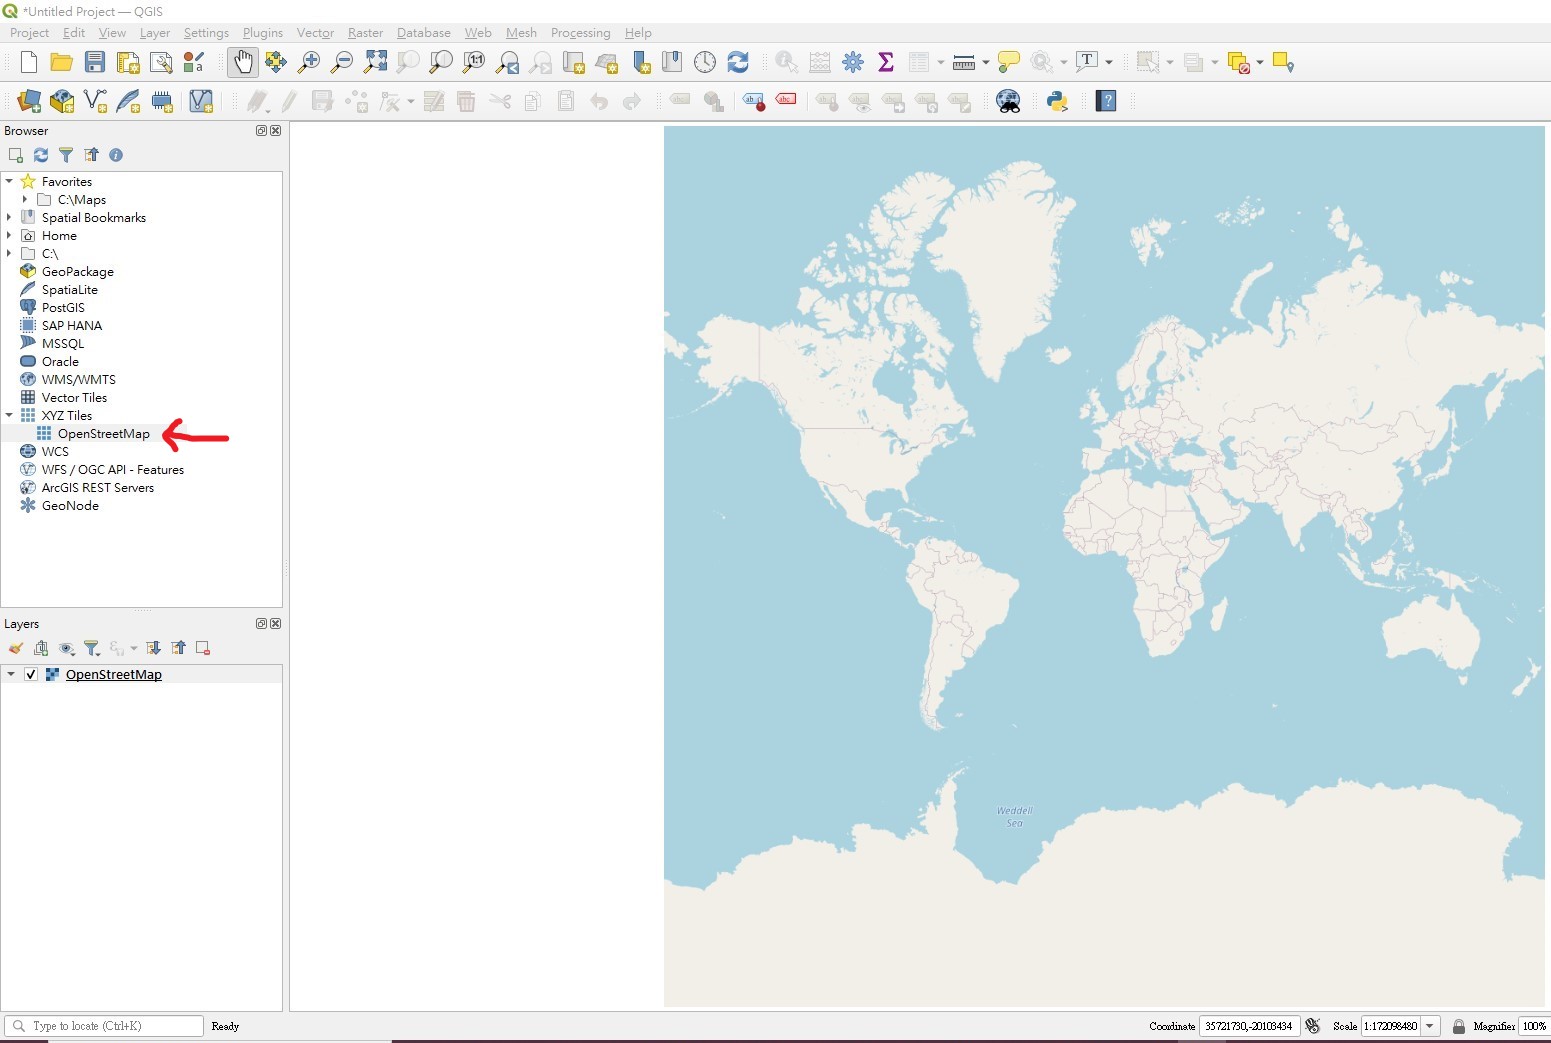 使用View>內的指令移動縮放地圖。可以使用滑鼠滾輪縮放地圖,游標在地圖上移動,下方狀態列的Coordinate會顯示經緯度。
這個地圖原則上就是一張圖,基本上我們可以使用QGIS開啟圖形,開啟後仍然為一個layer,可以在螢幕左下方的Layers處看出。不過隨意開的圖形因為沒有經緯度設計,似乎其左上角座標預設為0,0。
Digital Map
我們需要電子地圖才能操作地圖,光是圖片無法滿足需求。因此我們首先到Natural Earth這個網站下載地圖,選擇SHP或是GeoPackage應該都可以(按滑鼠右鍵下載)。
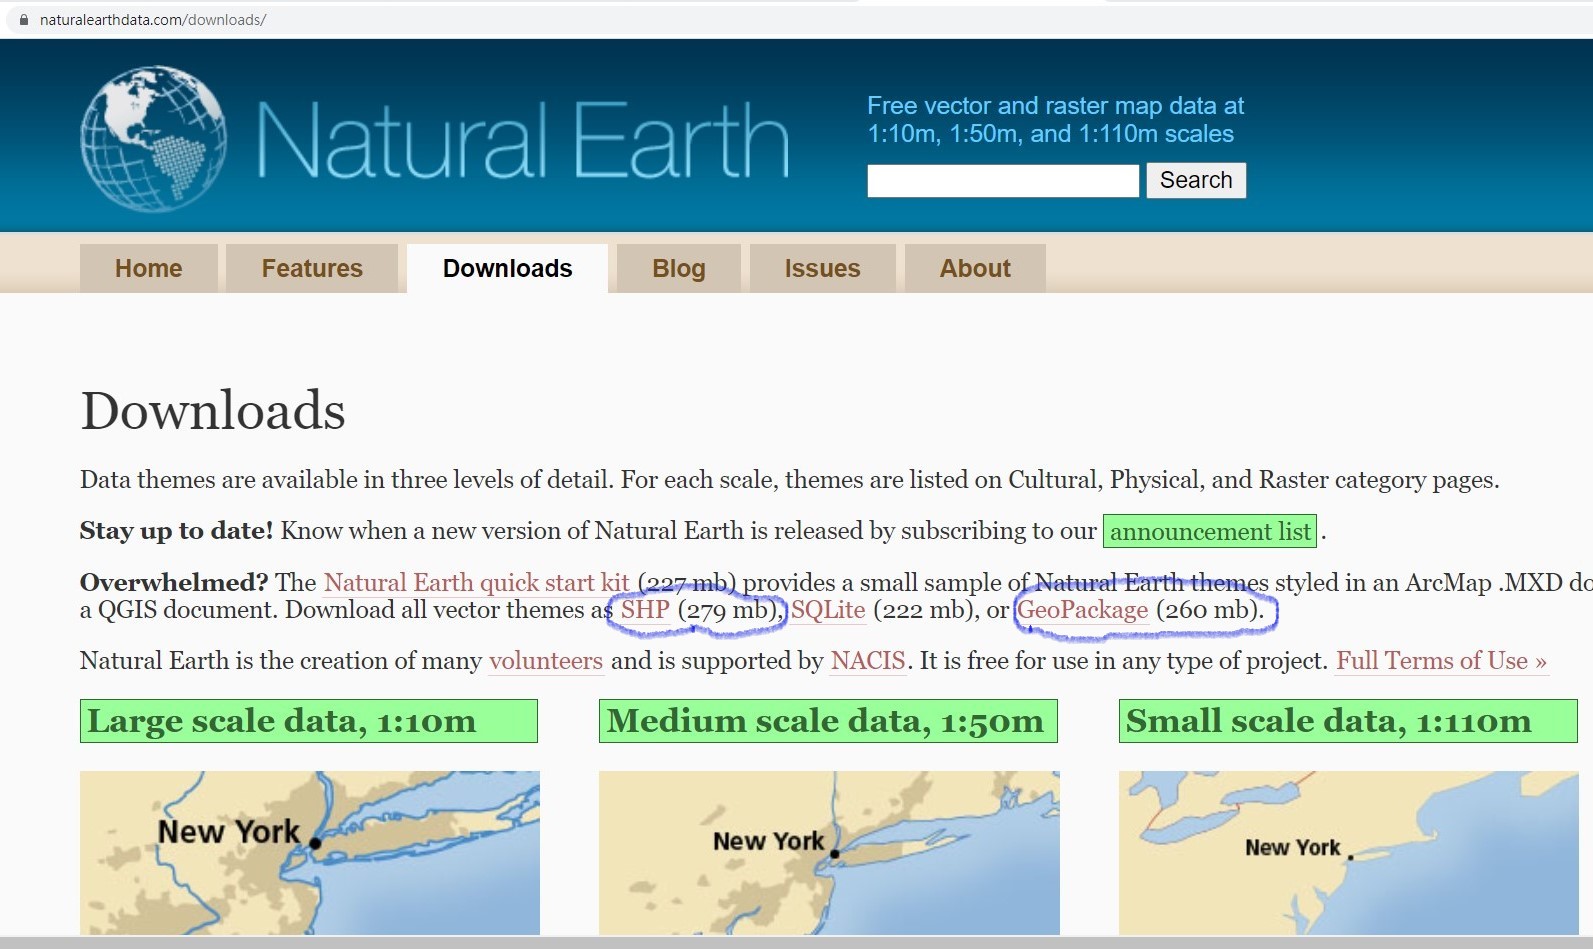
之後建立一個資料夾解壓縮。為了方便使用,我們可以在左方的Browser處找到Favorites,按滑鼠右鍵選擇Add a Directory,然後選擇地圖位置的資料夾,這個方式可以讓我們較為快速選擇我們需要的檔案。
接下來試著開啟下載的地圖,找到以下檔案開啟:
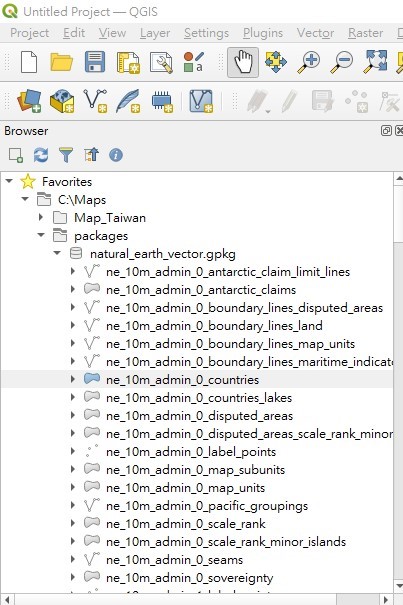
可以看到世界地圖的國家輪廓,此一圖層僅記錄國家資訊。選擇Layer > Open Attribute Table (F6)或是在圖層上點擊滑鼠右鍵 > Open Attribute Table,可以開啟圖層屬性表格。選擇其中某一或多個資料(使用Shift & Ctrl協助),回到地圖,使用Zoom to Selection,可以看到被選擇的國家顏色改變,表示被選取。也可以使用快捷列:

Styling
打開Layer > Layer Properties...或是在圖層點擊滑鼠右鍵選擇Properties,然後選擇Symbology。上方顯示Single Symbol,直接改變Color及Opacity等相關屬性。接著將Single Symbol改變為Categorized,Value選擇Continent,然後在下方點擊Classify,出現各不同大陸的顏色列表,可以個別改變顏色,點選套用來改變Style。
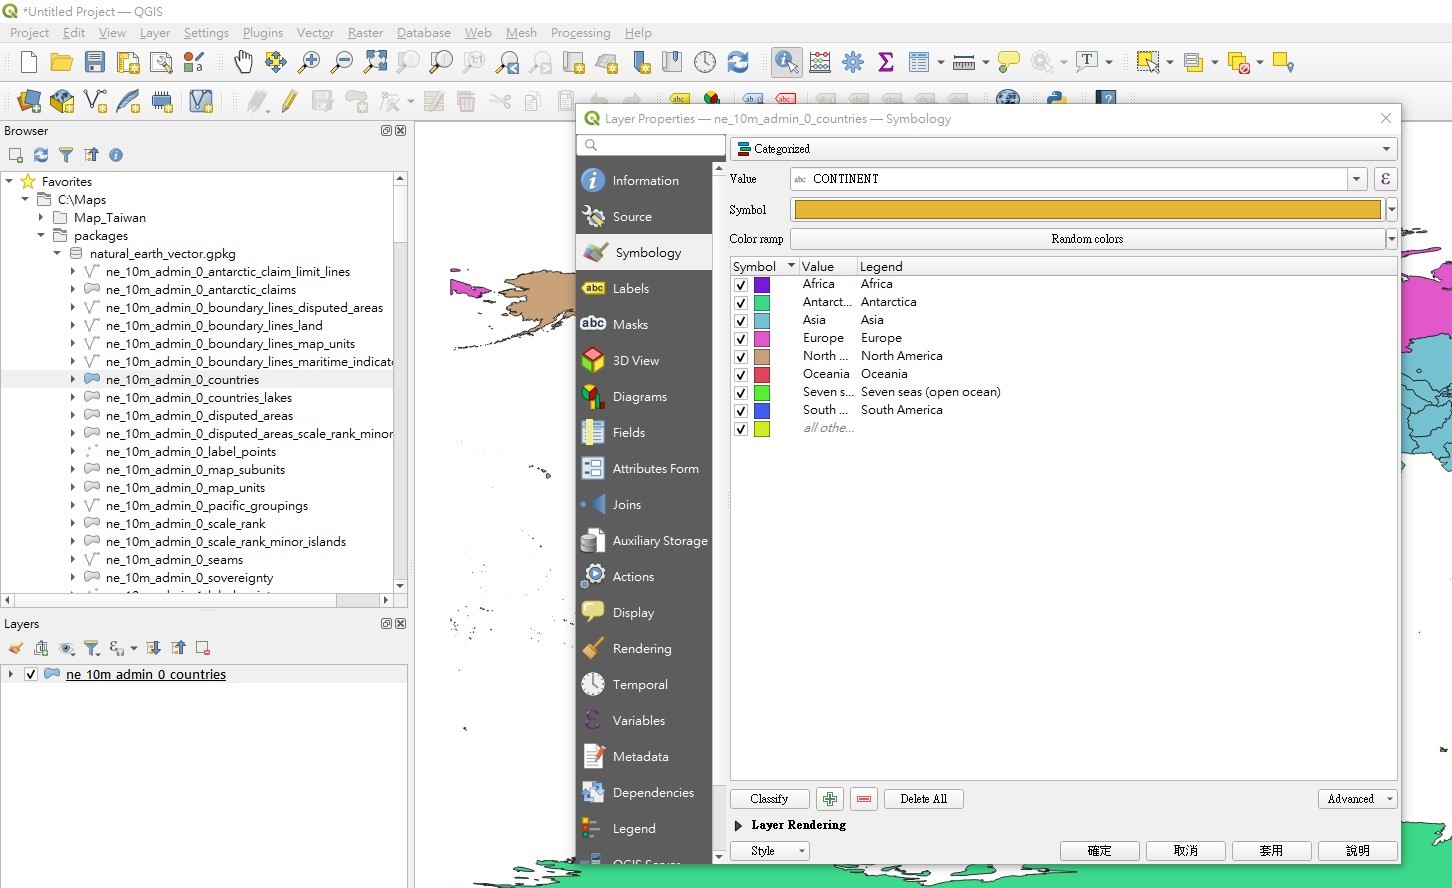
再次開啟Properties,選擇Labels,Value選擇NAME,可作修飾後選確定,此時可看到每個國家的名稱。
選擇Layer > Filter...,開啟後輸入如下,點擊確定。此時僅顯示亞洲。
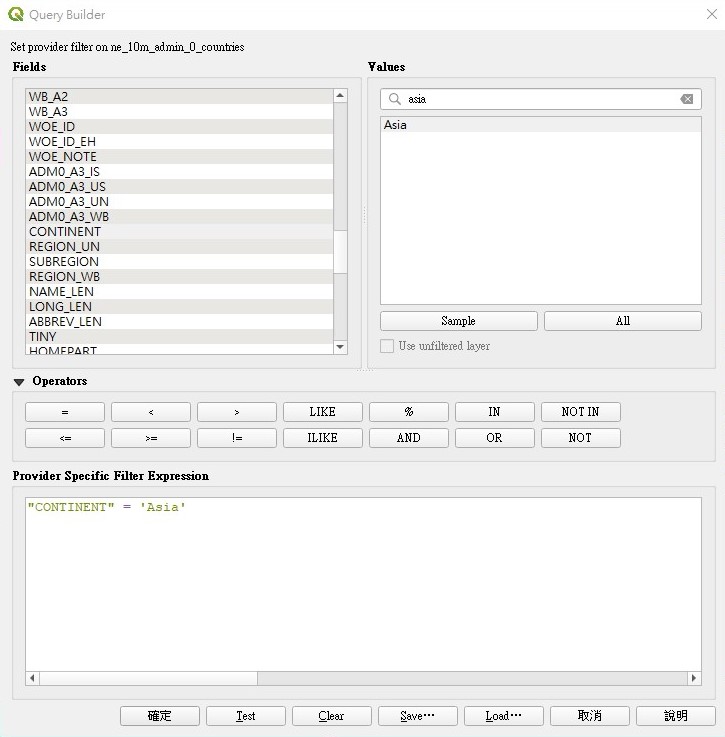
在Layer上點選右鍵 > Export > Save Features As...,出現Save Vector Layer As...視窗,修改如下:
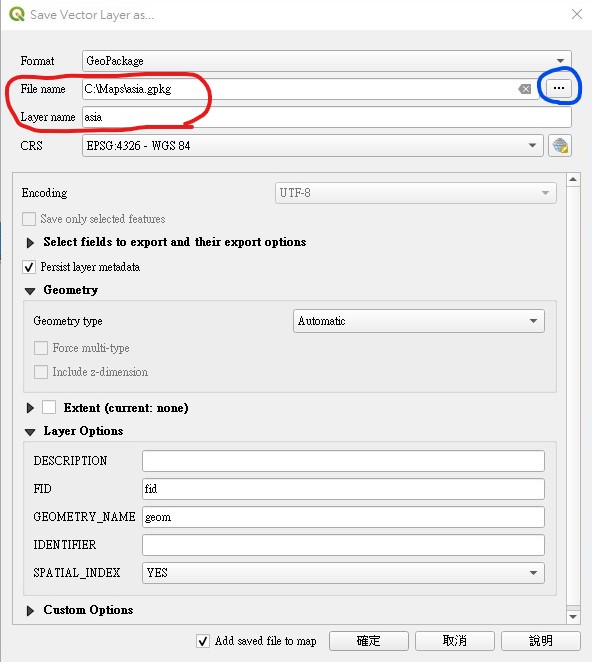
確定後會出現新的圖層。回到原有圖層,開啟Filter...,選擇Clear然後確定,去除原有filter條件,會顯現出世界地圖。將圖層前之勾選去除,此時僅顯現asia圖層。開啟Open Attribute Table,可以看出此圖層的Continent全部都是Asia。
開啟asia圖層之properties > Symbology,與之前之步驟同,根據fid將每個國家著色。此時每個亞洲國家顯示顏色各不相同。在Map_Taiwan資料夾選擇高雄市 > info > EROAD.shp,雙擊或拖曳開啟。
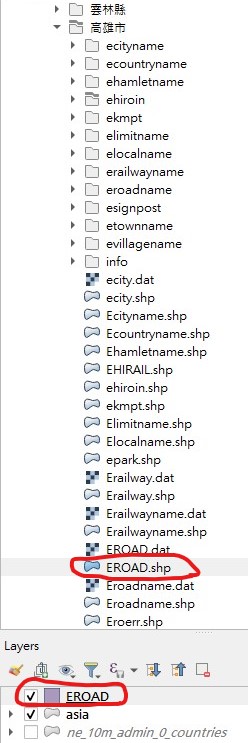
可以在Layers看到開啟EROAD圖層,此時在地圖上的高雄位置應該要有此圖層顯示,不過卻沒看到,不過選擇EROAD圖層然後點Zoom to Layer,應會顯示高雄市街道地圖。開啟Layer > Set CRS of Layer(s)或是右鍵點擊圖層,選Layer CRS > Set Layer CRS...,開啟以下視窗。
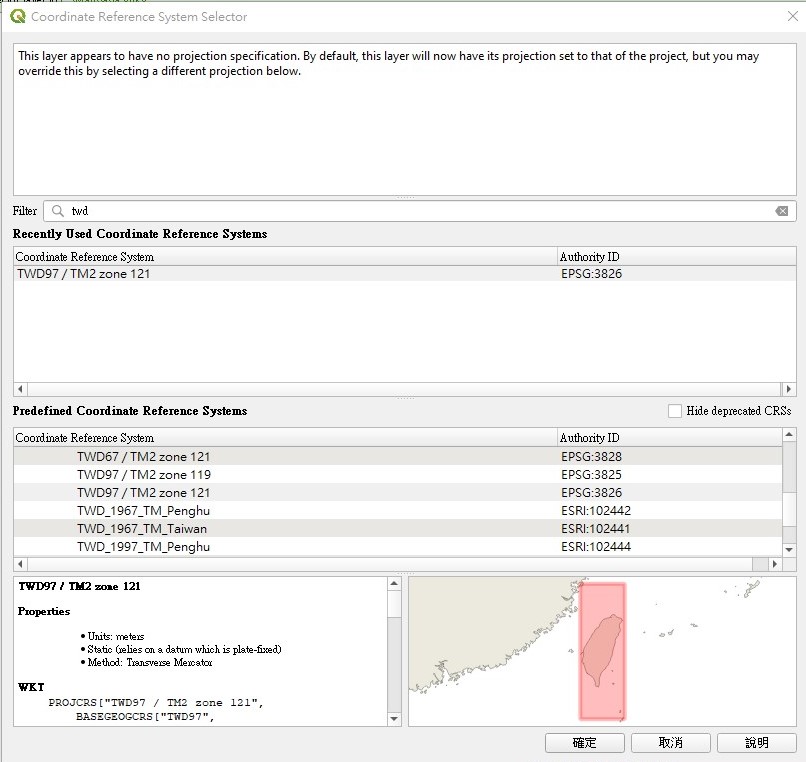
Filter輸入TW,選擇合適之經緯度系統,點擊確定,即可在正確位置找到圖層。
讀取檔案資料
首先需有跟地圖相關的資料檔案,因為之後要顯示在地圖,所以最重要的要有x,y位置資料(也就是Longitude & Latitude),例如:
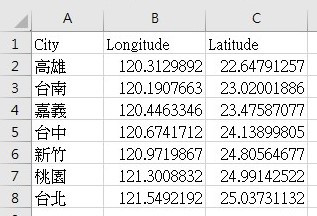
將其存為tab分隔之文字檔。接著開啟Data Source Manager如下:
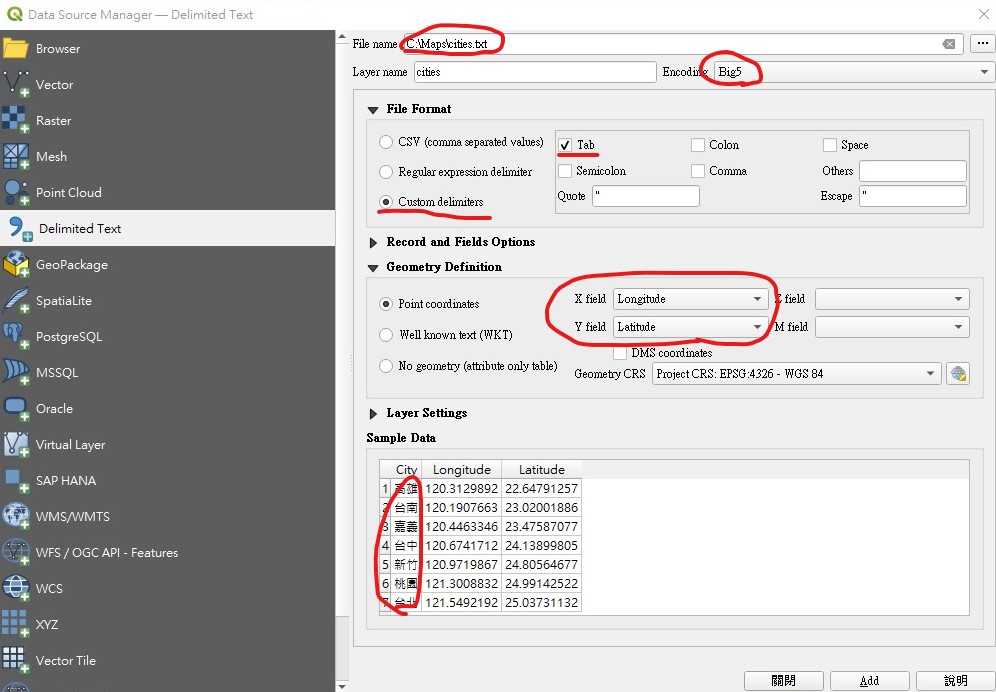
Encoding選big5的原因是因為裡面打了中文,注意要對應經緯度。確定後應即可看到對應的都市點。此時可以加上style & label。
Join
設計如下之資料檔案:
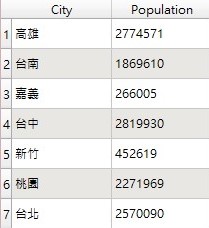
將其開啟。選擇cities圖層,右鍵選擇Properties,然後選擇Joins。
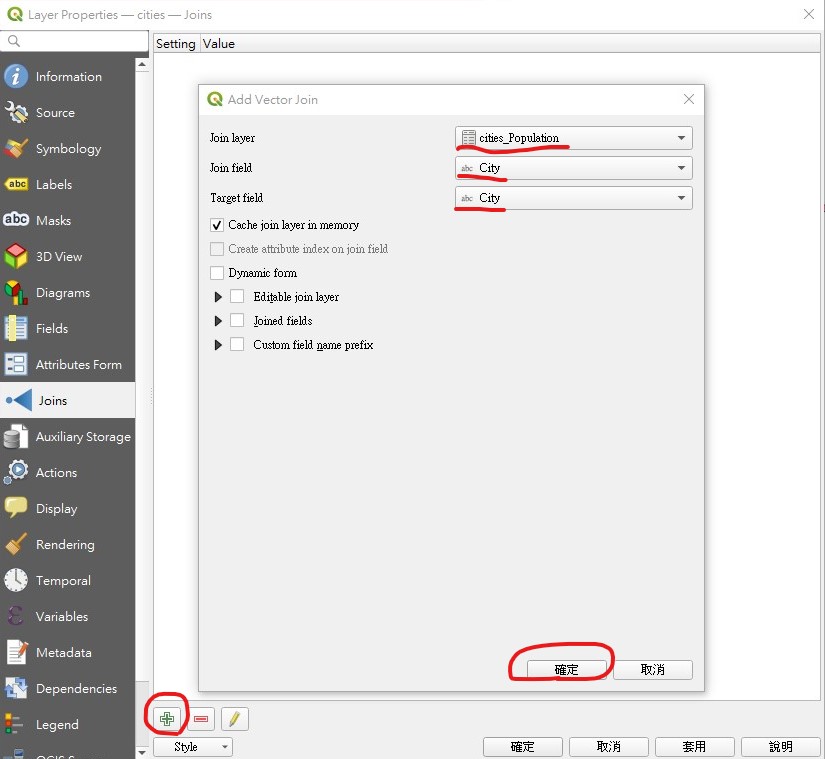
點擊下方的+號,出現視窗,選擇要連結的檔案以及對應的欄位,確定後可得到joined view。開啟Attribute Table查看內容,並將人口資料作為Label顯示。
點選cities右鍵 > Export > Save Features As...,將合併後的檔案存為shp file,之後可以直接使用此shp file。
print layout
開啟Porject > New Print Layout...,建立名稱後,進入如下視窗:
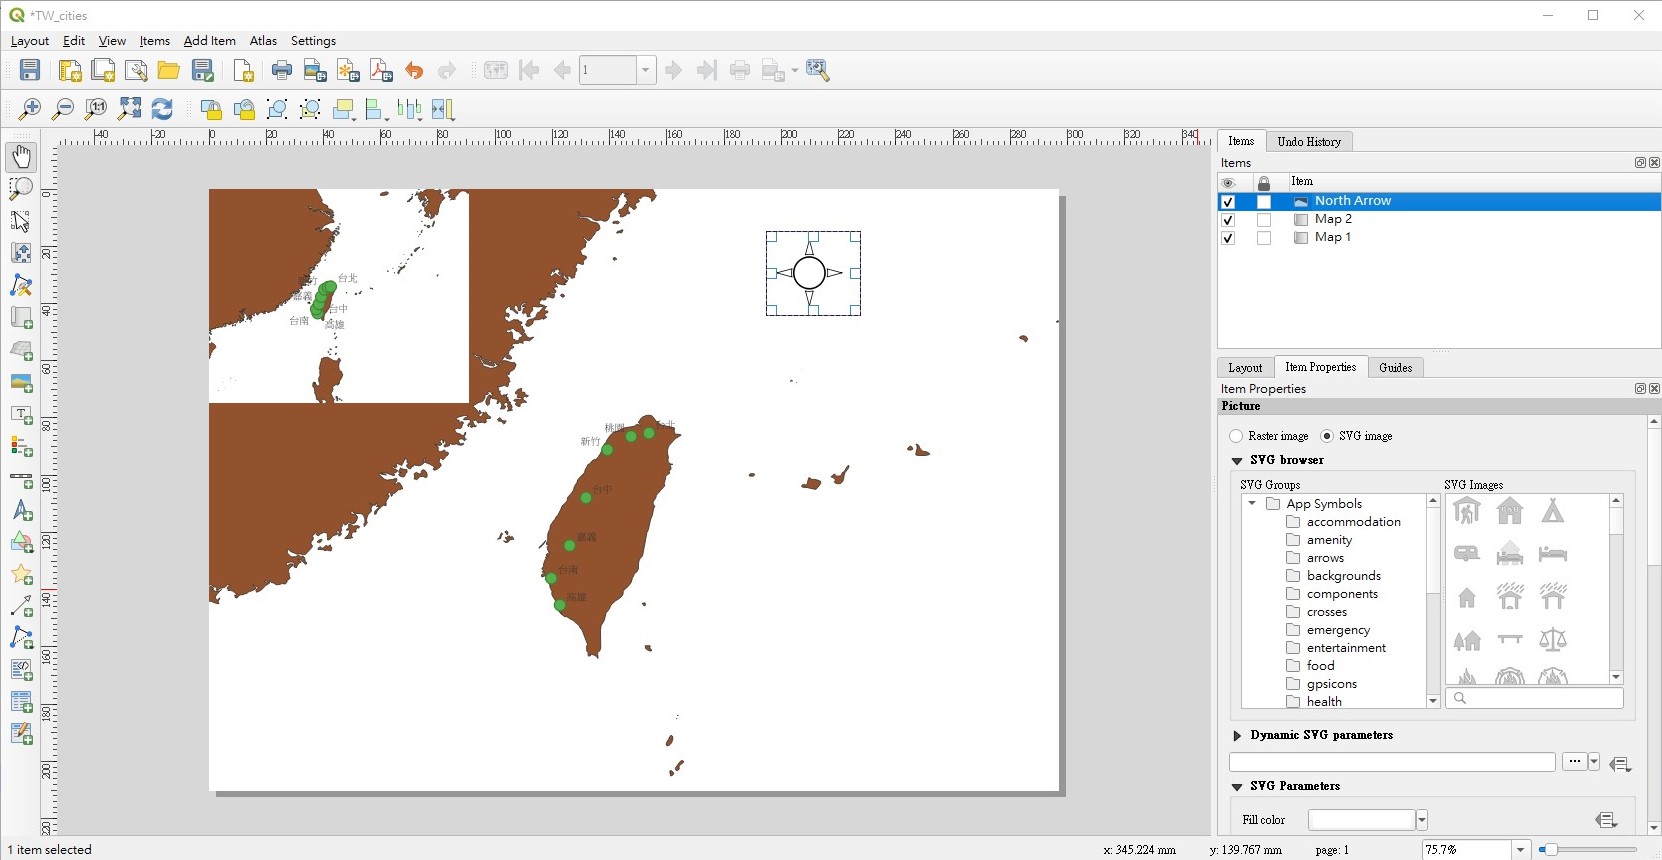
選擇Add Item > Add Map加入地圖,然後逐步加入所需的地圖元件。最後可以選擇Layout > Export as Image...,將layout存為圖片。
Selection
Selection可以使用以下按鈕:

或是在Edit > Select > Select Feature(s),直接框取即可選擇。到Project > Properties... > General > General Settings,可以改變selection的顏色。
在Layer上點選右鍵,選擇Export > Save Selected Features As...
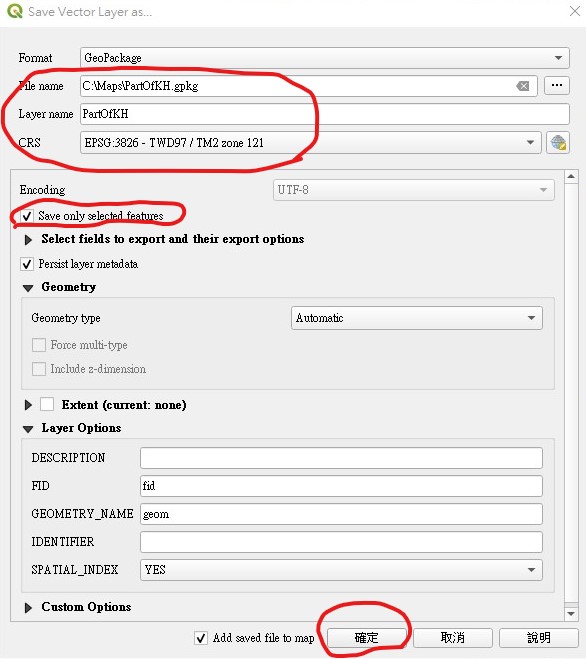
如此可以簡單地取得某一部分的地圖資料。
Merge maps
若欲將兩個file合併為一個,首先開啟此兩個檔案。到Vector > Data Management Tools > Merge vector Layers...開啟如下視窗:
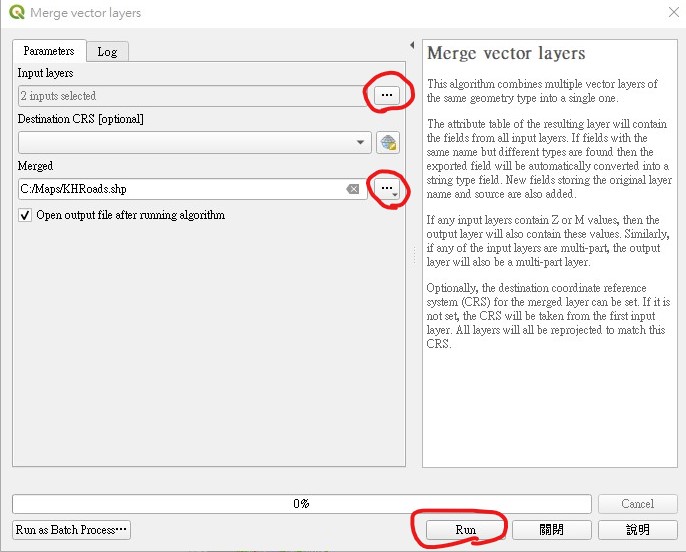
點擊在Input layers後的...,選擇要合併的layer。點擊Merged後的...,決定合併後的檔案類型及名稱。點擊Run執行。執行後便可得到合併在一起的檔案。開啟Attribute Table,觀察若是中文字顯示有問題,點選layer右鍵,開啟properties...,找到Source > Settings,改變encoding(常用的可能為big5或是UTF-8),應就可正確顯示。
shortest path
計算路網中的最短路徑,首先開啟一個線的圖層。開啟Processing > Toolbox,搜尋Network Analysis,找到Shortest path (point to point),選擇開啟。
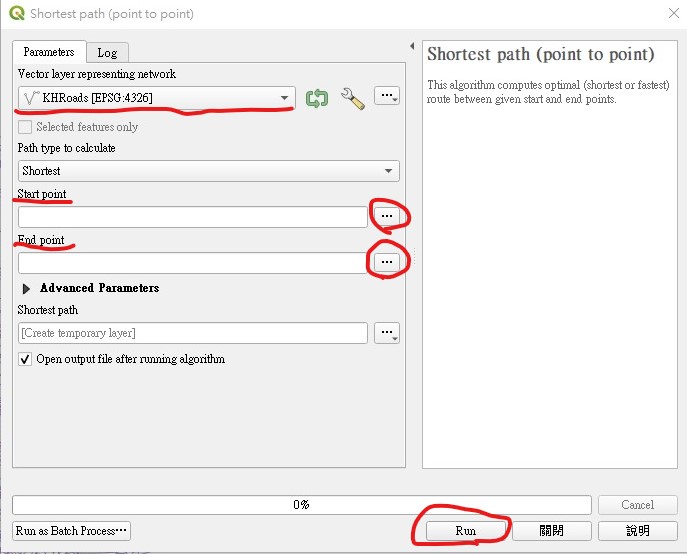
設定network layer, 點擊start point後的...,選擇起點。點擊end point後的...,選擇終點。點擊Run計算,會出現一個暫時layer來顯示路徑。可以修改其style。
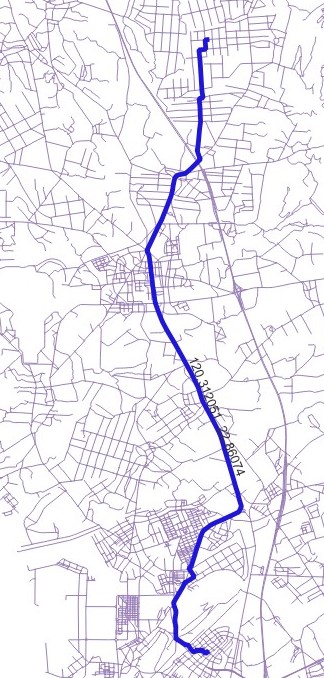
PyQGIS
QGIS支援使用Python設計,首先開啟Plugins > Python Console,出現如下之python console:
在>>>後輸入指令,例如
print("Hello, World")
或是其他簡單的python語法,可正確運作即可。原則上我們常不會只需要一行指令,所以需要編輯器來幫我們寫成一個檔案,QGIS中提供方便的編輯工具,如下:

開啟圖層
因為在QGIS中,處理的原則上是layer的資料,所以首先我們使用程式開啟layer。
uri = "C:/Maps/packages/natural_earth_vector.gpkg|layername=ne_10m_admin_0_countries"
iface.addVectorLayer(uri, "countries", "ogr")
uri儲存的是layer路徑,原則上我們可以在Layer Properties > Information > Information from provider中的Source得到。而iface大概是最重要的物件,用來與QGIS互動。首先使用其中的方法
addVectorLayer(self, vectorLayerPath: str, baseName: str, providerKey: str) → QgsVectorLayer參數vectorLayerPath便是uri,接下來的參數baseName是圖層名稱,自選。最後的參數providerKey,對大部分的vector data,通常的值是OGR(也可能是“postgres”, “delimitedtext”, “gpx”, “spatialite”, and “WFS”,可詳見官網說明)。
點擊執行(Run Script)後,應可見圖層被開啟(因為此處執行並不會自動存檔,請記得儲存)。
根據addVectorLayer()的定義,呼叫此方法會傳回QgsVectorLayer物件,也就是圖層,所以我們可以建立以下程式:
uri = "C:/Maps/packages/natural_earth_vector.gpkg|layername=ne_10m_admin_0_countries"
vlayer = iface.addVectorLayer(uri, "countries", "ogr")
iface.showAttributeTable(vlayer)
方法showAttributeTable()用來開啟Attribute Table。
有的圖檔沒有source,可使用另一個開啟layer的方法,如下:
uri = "C:/Maps/packages/natural_earth_vector.gpkg|layername=ne_10m_admin_0_countries"
vlayer = iface.addVectorLayer(uri, "countries", "ogr")
ulayer = QgsVectorLayer("C:\Maps\KHRoads.shp", "KH", "ogr")
if not ulayer.isValid():
    print("Layer failed to load!")
else:
    QgsProject.instance().addMapLayer(ulayer)
iface.showAttributeTable(vlayer)
使用QgsVectorLayer(),變數提供路徑。之後使用QgsProject.instance().addMapLayer(ulayer)語法添加圖層。
我們可以直接開啟圖層,不一定要用程式開啟。此時若要連結到圖層,則使用如下語法:
ulayer = iface.activeLayer()
印出所有開啟的圖層,使用QgsProject.instance().mapLayers()來取得所有layer,為一個dict。
uri = "C:/Maps/packages/natural_earth_vector.gpkg|layername=ne_10m_admin_0_countries"
vlayer = iface.addVectorLayer(uri, "countries", "ogr")
ulayer = QgsVectorLayer("C:\Maps\KHRoads.shp", "KH", "ogr")
if not ulayer.isValid():
    print("Layer failed to load!")
else:
    QgsProject.instance().addMapLayer(ulayer)

## 取得所有圖層
layers = QgsProject.instance().mapLayers()
print("----------layers------------")
print(layers)

## 取得layer names
layernames = [lay.name() for lay in QgsProject.instance().mapLayers().values()]
print("----------layernames------------")

## 取得圖層內資料
print(f"{layernames}")
# dictionary with key = layer name and value = layer object
layers_list = {}
for lay in QgsProject.instance().mapLayers().values():
  layers_list[lay.name()] = lay
print("-----------layers_list-----------")
print(layers_list)

# 直接根據名稱取得圖層物件
print("-----------mapLayersByName-----------")
print(QgsProject.instance().mapLayersByName("KH")[0])
所有圖層也是一個樹狀結構,其中的節點有兩種型態:
uri = "C:/Maps/packages/natural_earth_vector.gpkg|layername=ne_10m_admin_0_countries"
vlayer = iface.addVectorLayer(uri, "countries", "ogr")
ulayer = QgsVectorLayer("C:\Maps\KHRoads.shp", "KH", "ogr")
if not ulayer.isValid():
    print("Layer failed to load!")
else:
    QgsProject.instance().addMapLayer(ulayer)


## 取得root
root = QgsProject.instance().layerTreeRoot()
print("----------root------------")
print(root)
print("----------root.children()------------")
print(root.children())
print(root.children()[0]) # retrieve其中一個child
## 取得圖層id
ids = root.findLayerIds()
print("----------ids------------")
print(ids)
print(ids[0]) # retrieve其中一個id

## 列出Table of content(TOC)中所有checked layers
print("----------checkedLayers------------")
print(root.checkedLayers())

###############################################
## 使用root加入新圖層
# create a temporary layer
layerPath = "C:/Maps/packages/natural_earth_vector.gpkg|layername=ne_10m_ocean"
ocean = QgsVectorLayer(layerPath, "Ocean", "ogr")

## 任選一種方式:
# 1. 加到最下方
root.addLayer(ocean)

# 2. 加到特定位置
#root.insertLayer(0, ocean)

# 3. 當然也可以使用如下方式:如前所述
#QgsProject.instance().addMapLayer(ocean)
### -------------------------------------------------- ###

## vector layer與tree layer的轉換
node_layer = root.findLayer(vlayer.id())
print("Layer node:", node_layer) ## << tree node layer
print("Map layer:", node_layer.layer()) ## << map vector layer

## 使用ids來取得所有layer
#ids = root.findLayerIds()
#for i in ids:
#    node_layer = root.findLayer(i)
#    print("Layer node:", node_layer) ## << tree node layer
#    print("Map layer:", node_layer.layer()) ## << map vector layer


## 增加group並將某一layer移至此group
group1 = root.addGroup('One Group') ## 加到最後
#root.insertChildNode(0, group1) ## 加到位置0
theulayer = root.findLayer(ulayer.id()) ## 找到ulayer
cloneu = theulayer.clone() ## clone ulayer
parent = theulayer.parent() # 找到ulayer的parent
group1.insertChildNode(0, cloneu) # 將cloneu加到group1
parent.removeChildNode(theulayer) # 刪除theulayer節點
Attribute Table
此刻的vlayer與ulayer分別代表兩個圖層,我們可以得到其中Attribute Table的資料:#uri = "C:/Maps/packages/natural_earth_vector.gpkg|layername=ne_10m_admin_0_countries"
#vlayer = iface.addVectorLayer(uri, "countries", "ogr")
#ulayer = QgsVectorLayer("C:\Maps\KHRoads.shp", "KH", "ogr")
#if not ulayer.isValid():
# print("Layer failed to load!")
#else:
# QgsProject.instance().addMapLayer(ulayer)
iface.showAttributeTable(vlayer)
for field in vlayer.fields():
print(field.name())
已經完成的步驟可以comment掉,便不會重複執行。valyer.fields()傳回Attribute Table的fields,根據每個field呼叫name()可以得到field的名稱。
類似的觀念,我們可以使用以下語法取得某一欄位的所有資料:
for feature in vlayer.getFeatures():
    print(feature['fid'])
接下來首先我們先嘗試右鍵點擊layer > filter...,在Query Builder內輸入"ADMIN" like "A%",此時我們可以看到僅顯示A開頭的國家。選擇Clear清除。接下來使用PyQGIS方法:
vlayer.setSubsetString("ADMIN like 'A%'")
for feature in vlayer.getFeatures():
    print(feature['ADMIN'])
此時可以看到僅顯示A開頭的國家。回復顯示所有的方式,僅需改為setSubsetString("")即可。
練習:
for feature in vlayer.getFeatures():
    print(f"{feature['ADMIN']}({feature['NAME_ZH']}) has population = {feature['POP_EST']}")
先練習一下
uri = "C:/Maps/packages/natural_earth_vector.gpkg|layername=ne_10m_admin_0_countries"
countries = iface.addVectorLayer(uri, "countries", "ogr")
KH = QgsVectorLayer("C:\Maps\KHRoads.shp", "KH", "ogr")
if not KH.isValid():
    print("Layer failed to load!")
else:
    QgsProject.instance().addMapLayer(KH)

## 屬性欄fields
for field in countries.fields():
    print(field.name(), field.typeName())

print(countries.displayField()) ## 等同於layer properties > Display (點擊Show Map Tips,當滑鼠移至某區塊,將出現該資訊)
取得feature的type。
enum GeometryType { PointGeometry , LineGeometry , PolygonGeometry , UnknownGeometry , NullGeometry }
Note: print x可能導致程式當機,可能是資料量太大
uri = "C:/Maps/packages/natural_earth_vector.gpkg|layername=ne_10m_admin_0_countries"
countries = iface.addVectorLayer(uri, "countries", "ogr")
KH = QgsVectorLayer("C:\Maps\KHRoads.shp", "KH", "ogr")
ocean = iface.addVectorLayer("C:/Maps/packages/natural_earth_vector.gpkg|layername=ne_10m_ocean", "Ocean", "ogr")
if not KH.isValid():
    print("Layer failed to load!")
else:
    QgsProject.instance().addMapLayer(KH)

########################################################

features = ocean.getFeatures() ## 所有的feature(record)
for feature in features:
#    print("ID:", feature.id(), "Name:", feature['NAME'])
    # 取得每個feature(record)的幾何資料
    geom = feature.geometry()
#    print(geom) ## <QgsGeometry: Polygon(...)>
#    print(geom.type()) ## 2
    geomSingleType = QgsWkbTypes.isSingleType(geom.wkbType())
#    print(geomSingleType) # True, False
    if geom.type() == QgsWkbTypes.PointGeometry:
            # the geometry type can be of single or multi type
            if geomSingleType:
                x = geom.asPoint()## shape’s final geometry
                print("Point: ", x)
            else:
                x = geom.asMultiPoint() ## shape’s final geometry
                print("MultiPoint: ", x)
    elif geom.type() == QgsWkbTypes.LineGeometry:
        if geomSingleType:
            x = geom.asPolyline()## shape’s final geometry
            print("Line: ", x, "length: ", geom.length())
        else:
            x = geom.asMultiPolyline() ## shape’s final geometry
            print("MultiLine: ", x, "length: ", geom.length()) # print x 可能會資料量太大
    elif geom.type() == QgsWkbTypes.PolygonGeometry:
        if geomSingleType:
            x = geom.asPolygon()## shape’s final geometry
            print("Polygon: ", x, "Area: ", geom.area())
        else:
#            x = geom.asMultiPolygon()## shape’s final geometry
            print("Area: ", geom.area())
#            print("MultiPolygon: ", x, "Area: ", geom.area()) # 印了當機
    else:
        print("Unknown or invalid geometry")

    attrs = feature.attributes() # attributes
    print(attrs)
    break
除了使用feature['NAME'],也可以使用feature[index],e.g. feature[1]。
Selection
uri = "C:/Maps/packages/natural_earth_vector.gpkg|layername=ne_10m_admin_0_countries"
countries = iface.addVectorLayer(uri, "countries", "ogr")
KH = QgsVectorLayer("C:\Maps\KHRoads.shp", "KH", "ogr")
ocean = iface.addVectorLayer("C:/Maps/packages/natural_earth_vector.gpkg|layername=ne_10m_ocean", "Ocean", "ogr")
if not KH.isValid():
    print("Layer failed to load!")
else:
    QgsProject.instance().addMapLayer(KH)

########################################################
import random as rd
hexcolor = ['0', '1', '2', '3', '4', '5', '6', '7', '8', '9', 'a', 'b', 'c', 'd', 'e', 'f']
def randomColor1():
    """
    * 使用#rrggbb形式
    """
    co = "#"
    for i in range(6):
        co += rd.choice(hexcolor)
    return co

def randomColor2():
    """
    * 使用(R, G, B, Alpha)形式
    """
    return QColor(rd.randint(0,255),rd.randint(0,255),rd.randint(0,255),rd.randint(0,255))


# 改變selection color
#iface.mapCanvas().setSelectionColor(QColor(250, 150, 100, 50)) # last number indicates alpha (transparency 0~255), optional
#iface.mapCanvas().setSelectionColor(QColor("#abcdef"))
#iface.mapCanvas().setSelectionColor(QColor("blue"))
#iface.mapCanvas().setSelectionColor(QColor(randomColor1()))
iface.mapCanvas().setSelectionColor(randomColor2())

ocean.selectAll() ## 選擇全部 see also: Select Features (or Edit > Select > Select Feature(s))

countries.selectByExpression('"fid"=\'186\' or "fid"=\'154\'', QgsVectorLayer.SetSelection) ## 根據條件選擇

addFeatures = [1, 2, 8, 9, 20, 25, 30, 100]
countries.select(addFeatures)

ocean.removeSelection() ## To remove the selection
- 若欲全選(selection),使用selectAll()。(可使用iface.activeLayer()來取得目前active的layer)
- 若欲根據公式做selection,使用selectByExpression()。
- 使用iface.mapCanvas().setSelectionColor(QColor("blue"))修改slection feature的顏色。
- 使用removeSelection()來deselect feature。
iterating over selected features
歷遍selected feature。
uri = "C:/Maps/packages/natural_earth_vector.gpkg|layername=ne_10m_admin_0_countries"
countries = iface.addVectorLayer(uri, "countries", "ogr")
KH = QgsVectorLayer("C:\Maps\KHRoads.shp", "KH", "ogr")
ocean = iface.addVectorLayer("C:/Maps/packages/natural_earth_vector.gpkg|layername=ne_10m_ocean", "Ocean", "ogr")
if not KH.isValid():
    print("Layer failed to load!")
else:
    QgsProject.instance().addMapLayer(KH)

########################################################

countries.selectByExpression('"fid"=\'186\' or "fid"=\'154\'', QgsVectorLayer.SetSelection) ## 根據條件選擇

## 使用selectedFeatures()來取得某layer的selecction
selection = countries.selectedFeatures()
for feature in selection:
    print(feature['NAME'])
iterating over a subset of features
取得某區域內的元件(feature)。
uri = "C:/Maps/packages/natural_earth_vector.gpkg|layername=ne_10m_admin_0_countries"
countries = iface.addVectorLayer(uri, "countries", "ogr")
KH = QgsVectorLayer("C:\Maps\KHRoads.shp", "KH", "ogr")
ocean = iface.addVectorLayer("C:/Maps/packages/natural_earth_vector.gpkg|layername=ne_10m_ocean", "Ocean", "ogr")
if not KH.isValid():
    print("Layer failed to load!")
else:
    QgsProject.instance().addMapLayer(KH)

########################################################
areaOfInterest = QgsRectangle(-9.5,-32.2, 40, 36) # 選擇左下角及右上角座標
request = QgsFeatureRequest().setFilterRect(areaOfInterest) # 過濾該矩形內容
## 使用getFeatures(request)來取得request內的feature
for feature in countries.getFeatures(request):
    print(feature['NAME'])
Styling
利用PyQGIS來改變feature的style。首先選擇一個點的layer開啟:ulayer = iface.addVectorLayer("C:/Maps/packages/natural_earth_vector.gpkg|layername=ne_50m_geography_regions_points", "twcity", "ogr")
ulayer.renderer().symbol().setSize(5)
ulayer.renderer().symbol().setColor(QColor("red"))
ulayer.renderer().symbol().symbolLayer(0).setShape(QgsSimpleMarkerSymbolLayerBase.Star)
ulayer.triggerRepaint()
iface.layerTreeView().refreshLayerSymbology(ulayer.id())
renderer()讓我們得到renderer物件(e.g. Single Symbol (QgsSingleSymbolRenderer), Categorized (QgsCategorizedSymbolRenderer), Graduated (QgsGraduatedSymbolRenderer)等)
改變點的大小: 使用setSize()來修改點的大小。
改變點的顏色: 因為setColor()的輸入參數要求為一個QColor物件,所以產生一個QColor物件。
改變點的形狀: 使用symbolLayer(0)的原因是每一個symbol可以包含多個symbol layer,不過預設值為1個(aka symbolLayer(0))。而可得的形狀(QgsSimpleMarkerSymbolLayerBase)包含Arrow, ArrowHead, ArrowHeadFilled, Circle, Cross, Cross2, CrossFill, DiagonalHalfSquare, Diamond, EquilateralTriangle, HalfSquare, Hexagon, LeftHalfTriangle, Line, Pentagon, QuarterCircle, QuarterSquare, RightHalfTriangle, SemiCircle, Square, Star, ThirdCircle, and Triangle。
記得呼叫triggerRepaint()來重繪圖形。此外layerTreeView().refreshLayerSymbology(ulayer.id())用來更新layer前的示意圖形。
Renderer
當我們提交(render)一個圖層,其外觀由圖層的renderer跟symbols給定。Symbols classes用來負責繪出元件,而renderers則決定那一個symbol用在哪一個feature。cities = QgsVectorLayer("C:/Maps/twcity.shp", "cities", "ogr") ## remember to use / insteas of \
if not cities.isValid():
print("Layer failed to load!")
else:
QgsProject.instance().addMapLayer(cities)
################################################################################
cities_renderer = cities.renderer() ## 取得layer cities的renderer
print(cities_renderer.type()) # > singleSymbol
## renderer type 有許多,可以使用以下方式列出:
print(QgsApplication.rendererRegistry().renderersList())
## 使用dump()方法來取得rederer內容
print(cities_renderer.dump()) # > SINGLE: MARKER SYMBOL (1 layers) color 114,155,111,255
## 先使用createSimple()函數來建立點(QgsMarkerSymbol)、線(QgsLineSymbol)或面(QgsFillSymbol)的simbol
## 然後使用setSymbol()函數來改變symbol
symbol = QgsMarkerSymbol.createSimple({'name': 'square', 'color': 'red'})
symbol.setSize(10)
cities.renderer().setSymbol(symbol)
# show the change
cities.triggerRepaint() ##重畫
- see QgsMarkerSymbol Class for more information!
- QgsMarkerSymbol.createSimple({'name': 'square', 'color': 'red'})中name指的是marker的shape,可以有以下選擇:circle, square, cross, rectangle, diamond, pentagon, triangle, equilateral_triangle, star, regular_star, arrow, filled_arrowhead, x。
- 使用如下指令印出symbolLayers()[0]此層的完整symbol資訊:
print(cities.renderer().symbol().symbolLayers()[0].properties())此資訊可以讓我們很容易地修改一些屬性:# 修改屬性 cities.renderer().symbol().symbolLayer(0).setSize(5) # 不是所有屬性都有對應方法,可以直接修改其值 props = cities.renderer().symbol().symbolLayer(0).properties() props['color'] = 'yellow' props['name'] = 'diamond' cities.renderer().setSymbol(QgsMarkerSymbol.createSimple(props)) # show the changes cities.triggerRepaint() - 更多資訊請見官網。
設定layer feature, selected feature, and stroke顏色
uri = "C:/Maps/packages/natural_earth_vector.gpkg|layername=ne_10m_admin_0_countries"
countries = iface.addVectorLayer(uri, "countries", "ogr")
KH = QgsVectorLayer("C:\Maps\KHRoads.shp", "KH", "ogr")
ocean = iface.addVectorLayer("C:/Maps/packages/natural_earth_vector.gpkg|layername=ne_10m_ocean", "Ocean", "ogr")
if not KH.isValid():
    print("Layer failed to load!")
else:
    QgsProject.instance().addMapLayer(KH)

########################################################
import random as rd
def randomColor2():
    """
    * 使用(R, G, B, Alpha)形式
    """
    return QColor(rd.randint(0,255),rd.randint(0,255),rd.randint(0,255),rd.randint(0,255))
color = randomColor2()
print(f"{color.name()}")

countries.selectByExpression('"fid"=\'186\' or "fid"=\'154\'', QgsVectorLayer.SetSelection) ## 根據條件選擇

## 使用selectedFeatures()來取得某layer的selecction
selection = countries.selectedFeatures()
countries.renderer().symbol().setColor(QColor("blue")) ## 設定layer中feature的顏色
iface.mapCanvas().setSelectionColor( QColor("red") ) ## 設定layer中selected feature的顏色
for feature in selection:
    # 取得highlight物件
    highlight = QgsHighlight(iface.mapCanvas(), feature, countries)
    # 設定feature的邊框顏色
    highlight.setColor(color)
修改圖層(Modifying Vector Layers)
首先先檢查有哪些操作可以使用。uri = "C:/Maps/packages/natural_earth_vector.gpkg|layername=ne_10m_admin_0_countries"
countries = iface.addVectorLayer(uri, "countries", "ogr")
KH = QgsVectorLayer("C:\Maps\KHRoads.shp", "KH", "ogr")
ocean = iface.addVectorLayer("C:/Maps/packages/natural_earth_vector.gpkg|layername=ne_10m_ocean", "Ocean", "ogr")
if not KH.isValid():
print("Layer failed to load!")
else:
QgsProject.instance().addMapLayer(KH)
########################################################
caps_string = KH.dataProvider().capabilitiesString()
print(caps_string) # 印出所有可進行操作
## 確認某一操作是否有支援
caps = KH.dataProvider().capabilities()
if caps & QgsVectorDataProvider.DeleteFeatures:
print("可以刪除元件")
- 增加元件(Add Features)、修改元件(Modify Features)與刪除元件(Delete Features)。請注意這些編輯操作會直接作用於圖檔,若刪除元件請謹慎。
#uri = "C:/Maps/packages/natural_earth_vector.gpkg|layername=ne_10m_admin_0_countries" #countries = iface.addVectorLayer(uri, "countries", "ogr") KH = QgsVectorLayer("C:\Maps\KHRoads.shp", "KH", "ogr") #ocean = iface.addVectorLayer("C:/Maps/packages/natural_earth_vector.gpkg|layername=ne_10m_ocean", "Ocean", "ogr") if not KH.isValid(): print("Layer failed to load!") else: QgsProject.instance().addMapLayer(KH) ######################################################## caps = KH.dataProvider().capabilities() if caps & QgsVectorDataProvider.AddFeatures: fea = QgsFeature(KH.fields()) # fea.setAttributes([0, NULL]) # fea.setAttributes([1, NULL]) fea.setAttribute(2, 7) # index=2, value = 7 fea.setAttribute('layer', "KHSC25_R") # or fea.setAttributes(['layer', "KHSC25_R"]) # fea.setAttributes([4, "C:/Maps/�啁�啣�_Wgs84/蝮��銵��啣�/Khsc/KHSC25_R.TAB"]) ## check QgsGeometry for more details about geometry fea.setGeometry(QgsGeometry.fromPolyline([QgsPoint(120.277, 22.828), QgsPoint(120.484, 22.675)])) (res, outFeats) = KH.dataProvider().addFeatures([fea]) ## 修改某元件 if caps & QgsVectorDataProvider.AddFeatures: attrs = { 0 : "hello", 1 : 123 } # 修改屬性 KH.dataProvider().changeAttributeValues({ 21068 : attrs }) if caps & QgsVectorDataProvider.ChangeGeometries: geom = QgsGeometry.fromPolyline([QgsPoint(120.377, 23.828), QgsPoint(120.484, 22.675)]) # 修改幾何 KH.dataProvider().changeGeometryValues({ 21068 : geom }) # 刪除某元件 #if caps & QgsVectorDataProvider.DeleteFeatures: # res = KH.dataProvider().deleteFeatures([21068, 21069])#注意:編號為index(自0開始)(see Attribute Table) - 上述的方法會直接修改資料,無須確認儲存。我們也可以將修改先暫存於Buffer,待確認儲存後才變更資料,亦可放棄修正。
#uri = "C:/Maps/packages/natural_earth_vector.gpkg|layername=ne_10m_admin_0_countries" #countries = iface.addVectorLayer(uri, "countries", "ogr") KH = QgsVectorLayer("C:\Maps\KHRoads.shp", "KH", "ogr") #ocean = iface.addVectorLayer("C:/Maps/packages/natural_earth_vector.gpkg|layername=ne_10m_ocean", "Ocean", "ogr") if not KH.isValid(): print("Layer failed to load!") else: QgsProject.instance().addMapLayer(KH) ######################################################### with edit(KH): ##使用with>會自動呼叫commitChanges()成立>若出現例外>自動呼叫rollBack()放棄 fea1 = QgsFeature(KH.fields()) fea1.setId(21069) ## 開始編號,之後會依順序編號 fea1.setGeometry(QgsGeometry.fromPolyline([QgsPoint(120.277, 23.828), QgsPoint(120.484, 22.675)])) # add features (QgsFeature instances) KH.addFeatures([fea1]) #with edit(KH): # KH.deleteFeatures([fea1.id()-1]) ## deleteFeatures(index) >> index starts from 0 # KH.deleteFeature(21068) - 空間索引(Spatial Index):
index = QgsSpatialIndex(KH.getFeatures()) ## 加入空間索引(Spatial Index) nearest = index.nearestNeighbor(QgsPointXY(120.4, 22.7), 5) ## 找到距某點最近的5個feature print(nearest) - The QgsVectorLayerUtils class:
QgsVectorLayerUtils class包含許多有用的方法。例如getValues()。
cities = QgsVectorLayer("C:/Maps/twcity.shp", "cities", "ogr")
if not cities.isValid():
    print("Layer failed to load!")
else:
    QgsProject.instance().addMapLayer(cities)
#########################################################

cities.selectByIds([1]) # Selection > id=1
value = QgsVectorLayerUtils.getValues(cities, "City", selectedOnly=True) # 取得selection資料中的City欄位
print(value)
建立新的vector圖層
我們可以使用layer > Create Layer > New Shapefile Layer...來建立新的圖層,使用PyQGIS的方法:# 建立點的圖層,名稱為layername,使用memory data provider
layerl = QgsVectorLayer("Point", "layername", "memory")
# 增加資料欄位
from qgis.PyQt.QtCore import QVariant
pr = layerl.dataProvider()
pr.addAttributes([QgsField("name", QVariant.String),
QgsField("age", QVariant.Int),
QgsField("size", QVariant.Double)])
layerl.updateFields() # 更新欄位
# 加入一個點
f = QgsFeature()
f.setGeometry(QgsGeometry.fromPointXY(QgsPointXY(120.3,22.6))) # 點位置
f.setAttributes(["Ada L.", 2, 0.3]) # 設定該點屬性
pr.addFeature(f) # 將該點加入到layer的feature
layerl.updateExtents() # 更新內容
QgsProject.instance().addMapLayer(layerl) # 將layer加入到canvas
# 統計屬性
print("欄位(field)數:", len(pr.fields()))
print("元件(feature)數:", pr.featureCount())
e = layerl.extent()
print("Extent:", e.xMinimum(), e.yMinimum(), e.xMaximum(), e.yMaximum()) # 座標的極值
for f in layerl.getFeatures():
print("Feature:", f.id(), f.attributes(), f.geometry().asPoint()) # 所有feature的屬性
# 若想增加屬性欄位
layerl.startEditing() # 開始編輯
new_field_name = 'New field' # 新欄位名稱
layerl.addAttribute(QgsField(new_field_name, QVariant.String)) # 加入屬性,此欄位資料為string
layerl.updateFields() # 更新欄位
for f in layerl.getFeatures():
print("Feature:", f.id(), f.attributes(), f.geometry().asPoint())
# 更新資料
new_field_value = 'New value'
for f in layerl.getFeatures():
f[new_field_name] = new_field_value # 每一比資料的新欄位資料都是new_field_value
layerl.updateFeature(f) # 增加後更新
layerl.commitChanges() # 確認改變
for f in layerl.getFeatures():
print("Feature:", f.id(), f.attributes(), f.geometry().asPoint())
iface.vectorLayerTools().stopEditing(layerl) # 停止編輯
## 修該資料的替代方法:
my_field_name = 'New field 2'
my_field_value = 'New value 2'
with edit(layerl): # 使用with,無須手動呼叫startEditing(), commitChanges(), stopEditing()等
layerl.addAttribute(QgsField(my_field_name, QVariant.String))
layerl.updateFields()
for f in layerl.getFeatures():
f[my_field_name] = my_field_value
layerl.updateFeature(f)
如果增加的是線的圖層:
# 建立線的圖層,名稱為layername,使用memory data provider
layerl = QgsVectorLayer("LineString", "layername", "memory")

# 增加資料欄位
from qgis.PyQt.QtCore import QVariant
pr = layerl.dataProvider()
pr.addAttributes([QgsField("name", QVariant.String),
                  QgsField("age",  QVariant.Int),
                  QgsField("length", QVariant.Double)])
layerl.updateFields() # 更新欄位

lon1 = 120.3
lat1 = 22.6
lon2 = 120.5
lat2 = 22.8
linePoints = [QgsPoint(lon1,lat1), QgsPoint(lon2,lat2)]

line = QgsGeometry.fromPolyline(linePoints)
f = QgsFeature()
f.setGeometry(line) # 加入線
f.setAttributes(["River View", 2, 33.3]) # 設定該線屬性
pr.addFeature(f) # 將該線加入到layer的feature
layerl.updateExtents() # 更新內容
QgsProject.instance().addMapLayer(layerl) # 將layer加入到canvas

with edit(layerl): # 使用with,無須手動呼叫startEditing(), commitChanges(), stopEditing()等
    layerl.addAttribute(QgsField("from_lon", QVariant.Double))
    layerl.addAttribute(QgsField("from_lat", QVariant.Double))
    layerl.addAttribute(QgsField("to_lon", QVariant.Double))
    layerl.addAttribute(QgsField("to_lat", QVariant.Double))
    layerl.updateFields()
    for fea in layerl.getFeatures():
        fea["from_lon"] = lon1
        fea["from_lat"] = lat1
        fea["to_lon"] = lon2
        fea["to_lat"] = lat2
        layerl.updateFeature(fea)
練習:嘗試在線的圖層加入多條線。
import random as rd
# 建立線的圖層,名稱為layername,使用memory data provider
layerl = QgsVectorLayer("LineString", "layername", "memory")

# 增加資料欄位
from qgis.PyQt.QtCore import QVariant
pr = layerl.dataProvider()
pr.addAttributes([QgsField("name", QVariant.String),
                  QgsField("age",  QVariant.Int),
                  QgsField("length", QVariant.Double)])
layerl.updateFields() # 更新欄位

# 加入多條線
lon1 = 120.3
lat1 = 22.6
lon2 = 120.5
lat2 = 22.8
lon = [lon1, lon2]
lat = [lat1, lat2]

with edit(layerl): # 使用with,無須手動呼叫startEditing(), commitChanges(), stopEditing()等
    layerl.addAttribute(QgsField("from_lon", QVariant.Double))
    layerl.addAttribute(QgsField("from_lat", QVariant.Double))
    layerl.addAttribute(QgsField("to_lon", QVariant.Double))
    layerl.addAttribute(QgsField("to_lat", QVariant.Double))

for i in range(3):
    linePoints = [QgsPoint(lon1,lat1), QgsPoint(lon2,lat2)]

    lon1, lon2 = lon2, lon2 + rd.random()*(1)
    lat1, lat2 = lat2, lat2 + rd.random()*(1)

    lon.append(lon2)
    lat.append(lat2)

    line = QgsGeometry.fromPolyline(linePoints)
    f = QgsFeature()
    f.setGeometry(line) # 加入線
    f.setAttributes(["River View", 2, 33.3, lon1, lat1, lon2, lat2]) # 設定該線屬性
    pr.addFeature(f) # 將該線加入到layer的feature
    layerl.updateExtents() # 更新內容
    QgsProject.instance().addMapLayer(layerl) # 將layer加入到canvas
練習:嘗試建立面的圖層。
Geometry
Geometry就是讓我們操作幾何圖形,原則上就是指點線面。在QGIS中,使用QgsGeometry class來儲存與表達。有時候一個geometry實際上是一堆單一的geometries的集合(Collection),此類稱之為multi-part geometry,如果是包含單一類型,我們可以稱之為 multi-point, multi-linestring or multi-polygon。e.g. 一個區域由多個島嶼組成,則為multi-polygon。在QGIS中,有多種建立geometry的方式,首先先回顧一下下例:
# 建立點的圖層,名稱為layername,使用memory data provider
layer = QgsVectorLayer("Point", "layername", "memory")

# 增加資料欄位
from qgis.PyQt.QtCore import QVariant
pr = layer.dataProvider()
pr.addAttributes([QgsField("fid", QVariant.Int),
                  QgsField("longitude",  QVariant.Double),
                  QgsField("latitude", QVariant.Double)])
layer.updateFields() # 更新欄位

# 加入一個點
f = QgsFeature()
f.setGeometry(QgsGeometry.fromPointXY(QgsPointXY(120.3,22.6))) # 點位置
f.setAttributes([0, 120.3, 22.6]) # 設定該點屬性
pr.addFeature(f) # 將該點加入到layer的feature
layer.updateExtents() # 更新內容
QgsProject.instance().addMapLayer(layer) # 將layer加入到canvas
- from coordinates: 這是上一節所介紹建立一個新的layer的方式,我們使用QgsGeometry.fromPointXY(QgsPointXY(120.3,22.6))方式建立了一個點。這是建立geometry的方式之一。
aPoint = QgsGeometry.fromPointXY(QgsPointXY(120.7, 22.2)) print(aPoint) aLine = QgsGeometry.fromPolyline([QgsPoint(120.7, 22.2), QgsPoint(121.7, 23.2)]) print(aLine) aPolygon = QgsGeometry.fromPolygonXY([[QgsPointXY(120.7, 22.2), QgsPointXY(121.1, 22.6), QgsPointXY(120.2, 22.5)]]) print(aPolygon)接著一次加兩個點:圖層分為點線面,其中的元件僅能是對應的元件,亦即點的圖層僅能包含點# 建立點的圖層,名稱為layername,使用memory data provider layer = QgsVectorLayer("Point", "layername", "memory") # 增加資料欄位 from qgis.PyQt.QtCore import QVariant pr = layer.dataProvider() pr.addAttributes([QgsField("fid", QVariant.Int), QgsField("longitude", QVariant.Double), QgsField("latitude", QVariant.Double)]) layer.updateFields() # 更新欄位 ############################################################### # 加入點 aPoint = QgsGeometry.fromPointXY(QgsPointXY(120.7, 22.2)) f = QgsFeature() f.setGeometry(QgsGeometry.fromPointXY(QgsPointXY(120.3,22.6))) # 點位置 f.setAttributes([0, 120.3, 22.6]) # 設定該點屬性 ff = QgsFeature() ff.setGeometry(aPoint) # 點位置 ff.setAttributes([1, 120.7, 22.2]) # 設定該點屬性 pr.addFeatures([f, ff]) # 將該點加入到layer的feature layer.updateExtents() # 更新內容 QgsProject.instance().addMapLayer(layer) # 將layer加入到canvas - from well-known text (WKT):
gem = QgsGeometry.fromWkt("POINT (120.5 22.5)") print(gem) # <QgsGeometry: Point (120.5 22.5)>使用這個新的點代替上例中的aPoint,再試一次。aPoint = QgsGeometry.fromWkt("POINT (120.5 22.5)") - from well-known binary (WKB):
g = QgsGeometry() wkb = bytes.fromhex("010100000000000000000045400000000000001440") g.fromWkb(wkb) # print WKT representation of the geometry print(g.asWkt()) - 我們可以使用wkbType()來確認feature的型態:
aPoint = QgsGeometry.fromPointXY(QgsPointXY(120.7, 22.2)) if aPoint.wkbType() == QgsWkbTypes.Point: print(aPoint.wkbType()) # 1 表示點 # 直接印出feature type文字的方法 print(QgsWkbTypes.displayString(aPoint.wkbType())) aLine = QgsGeometry.fromPolyline([QgsPoint(120.7, 22.2), QgsPoint(121.7, 23.2)]) if aLine.wkbType() == QgsWkbTypes.LineString: print(aLine.wkbType()) # 2 表示線 # 直接印出feature type文字的方法 print(QgsWkbTypes.displayString(aLine.wkbType())) aPolygon = QgsGeometry.fromPolygonXY([[QgsPointXY(120.7, 22.2), QgsPointXY(121.1, 22.6), QgsPointXY(120.2, 22.5)]]) if aPolygon.wkbType() == QgsWkbTypes.Polygon: print(aPolygon.wkbType()) # 3 表示面 # 直接印出feature type文字的方法 print(QgsWkbTypes.displayString(aPolygon.wkbType())) ## 印出feature內容資訊 print(aPoint.asPoint()) # <QgsPointXY: POINT(120.70000000000000284 22.19999999999999929)> print(aLine.asPolyline()) # [<QgsPointXY: POINT(120.70000000000000284 22.19999999999999929)>, # <QgsPointXY: POINT(121.70000000000000284 23.19999999999999929)>] print(aPolygon.asPolygon()) # [[<QgsPointXY: POINT(120.70000000000000284 22.19999999999999929)>, # <QgsPointXY: POINT(121.09999999999999432 22.60000000000000142)>, # <QgsPointXY: POINT(120.20000000000000284 22.5)>, # <QgsPointXY: POINT(120.70000000000000284 22.19999999999999929)>]] - 若是個多元件的feature:
gPoint = QgsGeometry.fromWkt( 'Point(10 11)' ) for part in gPoint.parts(): print("gPoint:", part.asWkt()) # multi-point mPoint = QgsGeometry.fromWkt( 'MultiPoint( Point(0 1), Point(2 3), Point(4 5))' ) # same to : mPoint = QgsGeometry.fromWkt( 'MultiPoint( 0 1, 2 3, 4 5)' ) for part in mPoint.parts(): print("mPoint:", part.asWkt()) gLine = QgsGeometry.fromWkt( 'LineString( 0 0, 10 10 )' ) for part in gLine.parts(): print("gLine:", part.asWkt()) # multi-lineString mLine = QgsGeometry.fromWkt( 'MultiLineString(LineString( 0 0, 10 10 ), LineString( 0 0, 5 6 ))' ) for part in mLine.parts(): print("mLine:", part.asWkt()) gPolygon = QgsGeometry.fromWkt( 'Polygon(( 0 0, 10 10, 15 15 ))' ) for part in gPolygon.parts(): print("gPolygon:", part.asWkt()) # multi-polygon mPolygon = QgsGeometry.fromWkt( 'MultiPolygon(Polygon((0 0, 10 10, 15 15)), Polygon((1 0, 12 5, 12 12)))' ) for part in mPolygon.parts(): print("mPolygon:", part.asWkt()) - 可以使用上述的parts()方法來逐一修改feature屬性。
gPoint = QgsGeometry.fromWkt( 'MultiPoint( 0 0, 1 1, 2 2)' )
for part in gPoint.parts():
  part.transform(QgsCoordinateTransform(
    QgsCoordinateReferenceSystem("EPSG:4326"),
    QgsCoordinateReferenceSystem("EPSG:3111"),
    QgsProject.instance())# Returns the QgsProject singleton instance
  )
print("gPoint:", gPoint.asWkt())
QgsCoordinateReferenceSystem請參考下節介紹。 - 使用geometry進行操作:
uri = "C:/Maps/packages/natural_earth_vector.gpkg|layername=ne_10m_admin_0_countries" countries = iface.addVectorLayer(uri, "countries", "ogr") ########################################## # filter for countries that begin with U or T, then get their features query = '"name" LIKE \'U%\' or "name" LIKE \'T%\'' features = countries.getFeatures(QgsFeatureRequest().setFilterExpression(query)) # now loop through the features, perform geometry computation and print the results for f in features: gem = f.geometry() name = f.attribute('NAME') print(name) # 計算面積與邊界長度 print('Area: ', gem.area()) print('Perimeter: ', gem.length()) - 計算兩點間距離:
d = QgsDistanceArea()
d.setEllipsoid('WGS84')

# 計算兩點間距離
kh = QgsPointXY(120.312989200000004, 22.647912569999999)
tp = QgsPointXY(121.549219199999996, 25.037311320000001)

print("Distance in meters: ", d.measureLine(kh, tp))
管理圖層
管理圖層的幾個方法:- 圖層加入、修改與刪除
uri = "C:/Maps/twcity.shp" # remember to use / instead of \ vlayer = iface.addVectorLayer(uri, "twcity", "ogr") vlayer.setName("cities") # modify the name of the layer # create the buffered layer processing.runAndLoadResults("native:buffer", {'INPUT':uri,'DISTANCE':0.5,'SEGMENTS':1,'END_CAP_STYLE':0,'JOIN_STYLE':0,'MITER_LIMIT':1,'DISSOLVE':False,'OUTPUT':'memory:'}) project = QgsProject.instance() print(project.mapLayers()) # print all the layers (a dictionary) for id, layer in project.mapLayers().items(): print(layer.name()) # print the name of all layers project.mapLayersByName('Buffered')[0].setName("fromBuffered") # modified the name of the buffered layer # to remove a layer alayer = project.mapLayersByName('cities')[0] project.removeMapLayer(alayer.id()) - Projections: QGIS支援以下幾種座標系統格式。
- EPSG:<code> — ID assigned by the EPSG organization - handled with
createFromOgcWms() - POSTGIS:<srid>— ID used in PostGIS databases - handled with
createFromSrid() - INTERNAL:<srsid> — ID used in the internal QGIS database - handled with
createFromSrsId() - PROJ:<proj> - handled with
createFromProj() - WKT:<wkt> - handled with
createFromWkt() 。
建立QgsCoordinateReferenceSystem物件並使用相關函數:crs = QgsCoordinateReferenceSystem("EPSG:4326") print(crs.isValid()) # always check to see if this is True print("QGIS CRS ID:", crs.srsid()) print("PostGIS SRID:", crs.postgisSrid()) print("Description:", crs.description()) print("Projection Acronym:", crs.projectionAcronym()) # 投射之首字母縮寫 print("Ellipsoid Acronym:", crs.ellipsoidAcronym()) # 橢圓曲面之首字母縮寫 print("Proj String:", crs.toProj()) # check whether it's geographic or projected coordinate system print("Is geographic:", crs.isGeographic()) # check type of map units in this CRS (values defined in QGis::units enum) print("Map units:", crs.mapUnits()) """ Map units 0 Meters 1 Feet 2 Degrees 3 UnknownUnit 4 DecimalDegrees 5 DegreesMinutesSeconds 6 DegreesDecimalMinutes 7 NauticalMiles """ - EPSG:<code> — ID assigned by the EPSG organization - handled with
- 使用QgsCoordinateTransform進行座標轉換:
crsSrc = QgsCoordinateReferenceSystem("EPSG:4326")    # WGS 84
crsDest = QgsCoordinateReferenceSystem("EPSG:32633")  # WGS 84 / UTM zone 33N
transformContext = QgsProject.instance().transformContext()
xform = QgsCoordinateTransform(crsSrc, crsDest, transformContext)

# forward transformation: src -> dest
pt1 = xform.transform(QgsPointXY(18,5))
print("Transformed point:", pt1)

# inverse transformation: dest -> src
pt2 = xform.transform(pt1, QgsCoordinateTransform.ReverseTransform)
print("Transformed back:", pt2)
Map Canvas
畫布(Canvas)顯示包含圖層(layers)的地圖(map),我們可以使用map tools(panning, zooming, identifying layers, measuring, vector editing and others)來操控。畫布由QgsMapCanvas class in the qgis.gui module實現,每次我們操作地圖工具(例如移動或縮放),地圖會重新提交(render)成為一個圖片(使用QgsMapRendererJob物件),然後顯示在畫布上。此外canvas items是用來額外顯示或強調內容。例如rubber bands (used for measuring, vector editing etc.) or vertex markers。- 建立一個canvas:
canvas = QgsMapCanvas() canvas.setCanvasColor(Qt.blue) # default is white canvas.enableAntiAliasing(True) # for smooth rendering canvas.show() - 加入圖層:
canvas = QgsMapCanvas() canvas.setCanvasColor(Qt.white) # default is white canvas.enableAntiAliasing(True) # for smooth rendering canvas.show() cities = QgsVectorLayer('../../../Maps/twcity.shp', "cities", "ogr") if not cities.isValid(): print("Layer failed to load!") # set extent to the extent of our layer:設定範圍 canvas.setExtent(cities.extent()) # set the map canvas layer set:設定圖層(圖層放置於一個list) canvas.setLayers([cities]) - Rubber Bands and Vertex Markers:使用canvas item來顯示額外的資訊。主要有以下兩種好用的物件,第一為QgsRubberBand,可用來繪製曲線與面。
canvas = QgsMapCanvas() cities = QgsVectorLayer('../../../Maps/twcity.shp', "cities", "ogr") if not cities.isValid(): print("Layer failed to load!") # add layer to the registry:將圖層加入名冊 QgsProject.instance().addMapLayer(cities) # set extent to the extent of our layer:設定範圍 canvas.setExtent(cities.extent()) # set the map canvas layer set:設定圖層(圖層放置於一個list) canvas.setLayers([cities]) ## 顯示曲線 r = QgsRubberBand(canvas, False) # False = not a polygon points = [QgsPoint(119.8, 24.3), QgsPoint(122.1, 24.5), QgsPoint(120.7, 22.9)] r.setToGeometry(QgsGeometry.fromPolyline(points), None) r.setColor(QColor(0, 0, 255)) r.setWidth(3) ## 顯示面 p = QgsRubberBand(canvas, True) # True = a polygon ppoints = [[QgsPointXY(119.8, 24.3), QgsPointXY(119.2, 24.0), QgsPointXY(119.3, 23.3)]] p.setToGeometry(QgsGeometry.fromPolygonXY(ppoints), None) canvas.scene().removeItem(p) canvas.show()若不開啟新canvas,使用canvas = iface.mapCanvas() # 取得預定的canvas取得預定canvas,此時無需使用canvas.show()。不過執行刪除item時canvas.scene().removeItem(p)
顯示有點問題。 - 使用QgsVertexMarker建立marker。
#canvas = iface.mapCanvas() # 取得預定的canvas canvas = QgsMapCanvas() cities = QgsVectorLayer('../../../Maps/twcity.shp', "cities", "ogr") if not cities.isValid(): print("Layer failed to load!") # add layer to the registry:將圖層加入名冊 QgsProject.instance().addMapLayer(cities) # set extent to the extent of our layer:設定範圍 canvas.setExtent(cities.extent()) # set the map canvas layer set:設定圖層(圖層放置於一個list) canvas.setLayers([cities]) ## 顯示marker m = QgsVertexMarker(canvas) # 建立marker m.setCenter(QgsPointXY(120.3,23.7)) # 設定中心,此時已可顯示 ## 額外設定 m.setColor(QColor(0, 255, 0)) # 設定顏色 m.setIconSize(5) # 設定大小 m.setIconType(QgsVertexMarker.ICON_BOX) # or ICON_CROSS, ICON_X 設定形狀 m.setPenWidth(3) # 設定寬度 #canvas.scene().removeItem(m) # 刪除item canvas.show() - 可參考官網之Using Map Tools with Canvas範例來建立Canvas視窗。
- 我們可以讓使用者與地圖互動,點擊地圖某feature並以此為輸入值觸發callback()函數。
def callback(feature): ## 傳入使用者選擇(點擊)的feature """Code called when the feature is selected by the user""" print("You clicked on feature {}, {}".format(feature.id(), feature['NAME'])) # 開啟圖層 uri = "C:/Maps/packages/natural_earth_vector.gpkg|layername=ne_10m_admin_0_countries" vlayer = iface.addVectorLayer(uri, "countries", "ogr") # 取得canvas canvas = iface.mapCanvas() #vlayer = iface.activeLayer() feature_identifier = QgsMapToolIdentifyFeature(canvas) # 要求使用者選擇feature # indicates the layer on which the selection will be done 設定被選擇的layer feature_identifier.setLayer(vlayer) # use the callback as a slot triggered when the user identifies a feature # 將選擇的feature(feature_identifier)傳入callback()並執行 feature_identifier.featureIdentified.connect(callback) # activation of the map tool 設定選擇工具(有此指令方能選擇) canvas.setMapTool(feature_identifier) - see more examples on Writing Custom Map Canvas Items.
Expression & Filtering
- Expression是一個描述,讓我們取得想要的features。在QGIS中有數個地方有類似的功能,例如開啟Edit > Select > Select Features by Expression...或是Field Calculator(算盤圖示)等。基本變數型態為數字(number)、字串(str)與column reference。主要的操作計算有:
- arithmetic operators: +, -, *, /, ^
- parentheses: for enforcing the operator precedence: (1 + 1) * 3
- unary plus and minus: -12, +5
- mathematical functions: sqrt, sin, cos, tan, asin, acos, atan
- conversion functions: to_int, to_real, to_string, to_date
- geometry functions: $area, $length
- geometry handling functions: $x, $y, $geometry(), num_geometries, centroid。
- comparison: =, !=, >, >=, <, <=
- pattern matching: LIKE (using % and _), ~ (regular expressions)
- logical predicates: AND, OR, NOT
- NULL value checking: IS NULL, IS NOT NULL
- 接下來先來看如何確認一個expression是否被正確的parse。
exp = QgsExpression('1 + 1 = 2') # 建立一個QgsExpression物件
# > assert(False) > 顯示錯誤。
assert(not exp.hasParserError()) # 若有parse error (exp.hasParserError() == True)>顯示錯誤訊息

exp1 = QgsExpression('1 + 1 = ')
assert(exp1.hasParserError())

print(exp1.parserErrorString())
若出現例外錯誤,可使用assert()顯示錯誤訊息。 - 基本的expression evaluation:
exp = QgsExpression('2 * 3') print(exp) print(exp.evaluate()) ## return the result exp1 = QgsExpression('1 + 1 = 2') print(exp1.evaluate()) ## return 1 > True, 0 > False - 跟feature有關的expression:
import random as rd # create a vector layer 新建一個點圖層 vl = QgsVectorLayer("Point", "Companies", "memory") pr = vl.dataProvider() pr.addAttributes([QgsField("Name", QVariant.String), QgsField("Employees", QVariant.Int), QgsField("Revenue", QVariant.Double), QgsField("Rev. per employee", QVariant.Double), QgsField("Sum", QVariant.Double), QgsField("Fun", QVariant.Double)]) vl.updateFields() # 三個公司資訊 companyData = [ {'x': rd.randint(0,10), 'y': rd.randint(0,10), 'name': 'A Ltd.', 'emp': 10, 'rev': 100.1}, {'x': rd.randint(0,10), 'y': rd.randint(0,10), 'name': 'World Trade', 'emp': 2, 'rev': 50.5}, {'x': rd.randint(0,10), 'y': rd.randint(0,10), 'name': 'Super Sonic', 'emp': 100, 'rev': 725.9}] for rec in companyData: f = QgsFeature() pt = QgsPointXY(rec['x'], rec['y']) f.setGeometry(QgsGeometry.fromPointXY(pt)) # 公司位置點 f.setAttributes([rec['name'], rec['emp'], rec['rev']]) pr.addFeature(f) # 加入feature vl.updateExtents() # 改變資料後,更新地圖範圍 QgsProject.instance().addMapLayer(vl) # 建立project物件然後將圖層加入 print(QgsProject.instance().mapLayers()) # 印出所有圖層 print(QgsProject.instance().mapLayersByName('Companies')) # 根據名稱找到layer印出 ## 建立canvas然後加入圖層 #canvas = QgsMapCanvas() #canvas.setExtent(vl.extent()) #canvas.setLayers([vl]) #canvas.show() # 建立expressions ############################################ exp1 = QgsExpression('"Revenue"/"Employees"') exp2 = QgsExpression('sum("Revenue")') exp3 = QgsExpression('area(buffer($geometry,"Employees"))') ## exp3函數說明:練習函數用,無太多實質意義 # area: Returns the area of a geometry polygon feature. # Calculations are in the Spatial Reference System of this geometry # buffer: Returns a geometry that represents all points whose distance from this geometry is less than or equal to distance. # Calculations are in the Spatial Reference System of this geometry # $geometry: Returns the geometry of the current feature (can be used for processing with other functions) ## 建立expression內容,若無加入以下程式碼,後三欄無資料 context = QgsExpressionContext() context.appendScopes(QgsExpressionContextUtils.globalProjectLayerScopes(vl)) # QgsExpressionContextUtils.globalProjectLayerScopes() is a convenience # function that adds the global, project, and layer scopes all at once. with edit(vl): for f in vl.getFeatures(): context.setFeature(f) f['Rev. per employee'] = exp1.evaluate(context) # f['Rev. per employee'] = f['Revenue'] / f['Employees'] # 也可直接計算 f['Sum'] = exp2.evaluate(context) f['Fun'] = exp3.evaluate(context) vl.updateFeature(f) print(f['Sum'], f['Rev. per employee'], f["Fun"]) - Filter: 常用來過濾與選擇特定條件的features。
uri = "C:/Maps/packages/natural_earth_vector.gpkg|layername=ne_10m_admin_0_countries"
countries = iface.addVectorLayer(uri, "countries", "ogr")

expression = 'POP_RANK >= 17'
request = QgsFeatureRequest().setFilterExpression(expression) # request features
# 計算符合個數
matches = 0
for f in countries.getFeatures(request):
   matches += 1
   print(f['NAME'])

print(f"{matches}")

# recap: 建立selection
countries.selectByExpression(expression)
iface.mapCanvas().setSelectionColor(QColor("red"))
使用函數
我們可以開啟GeoPackage並使用OGR來取得所有的檔案名稱,並依此判斷某圖層是否存在於此GeoPackage,並依此作為開啟圖層或顯示錯誤訊息之依據。from osgeo import ogr
layerDir = 'C:/Maps/packages/natural_earth_vector.gpkg' # natural_earth_vector.gpkg的路徑
layers = [lay.GetName() for lay in ogr.Open(layerDir)] # 路境內所有的檔案名
print(layers)
# 判斷某圖層是否存在
print("Whatever" in layers) # False
print('ne_10m_parks_and_protected_lands_area' in layers) # True
#################################################
## 依以上方式來判斷某圖層存在後再進行開啟,否則顯示錯誤訊息
layerName1 = "Whatever"
layerName2 = 'ne_110m_ocean'
if layerName1 in layers:
iface.addVectorLayer(layerDir + "|layername=" + layerName1, layerName1, 'ogr')
else:
print(f"Error: There is no layer named {layerName1} in {layerDir}")
if layerName2 in layers:
iface.addVectorLayer(layerDir + "|layername=" + layerName2, layerName2, 'ogr')
else:
print(f"Error: There is no layer named {layerName2} in {layerDir}")
將上述流程寫成一個函數供使用:
from osgeo import ogr
layerDir = 'C:/Maps/packages/natural_earth_vector.gpkg' # natural_earth_vector.gpkg的路徑

def toAddLayer(layerdir, layername):
    layers = [lay.GetName() for lay in ogr.Open(layerdir)] # 路境內所有的檔案名
    if layername in layers:
        iface.addVectorLayer(layerDir + "|layername=" + layername, layername, 'ogr')
    else:
        print(f"Error: There is no layer named {layername} in {layerdir}")

toAddLayer(layerDir, "Whatever") # False
toAddLayer(layerDir, "ne_110m_land") # True
若是想要可以一次開啟多個圖層:
from osgeo import ogr
layerDir = 'C:/Maps/packages/natural_earth_vector.gpkg' # natural_earth_vector.gpkg的路徑

def toAddLayer(layerdir:str, layername:str):
    """
    * 開啟一個圖層
    """
    layers = [lay.GetName() for lay in ogr.Open(layerdir)] # 路境內所有的檔案名
    if layername in layers:
        iface.addVectorLayer(layerDir + "|layername=" + layername, layername, 'ogr')
    else:
        print(f"Error: There is no layer named {layername} in {layerdir}")

def toAddMultiLayers(layerdir:str, names:list):
    """
    * 開啟多個圖層
    """
    for name in names:
        toAddLayer(layerdir, name) # 呼叫 toAddLayer

toAddMultiLayers(layerDir, ["Whatever", "ne_110m_land", 'ne_110m_ocean']) # False, True, True
Map Rendering and Layouts
- 提交圖片:
vlayer = iface.activeLayer() # 先開啟一個layer,然後用此指令選擇the active one settings = QgsMapSettings() # QgsMapSettings物件用來配置 configuration settings.setLayers([vlayer]) # 設定layer settings.setBackgroundColor(QColor(255, 255, 0)) # 設定背景顏色 settings.setOutputSize(QSize(800, 600)) # 設定圖片輸出大小 settings.setExtent(vlayer.extent()) # 設定內容範圍 #settings.setExtent(settings.visibleExtent()) # 設定內容範圍 render = QgsMapRendererParallelJob(settings) # 提交設定好的圖 ## 完成render寫法 ############ def finished(): img = render.renderedImage() # save the image; e.g. img.save("/Users/myuser/render.png","png") img.save("C:/Maps/render.png", "png") render.finished.connect(finished) # Start the rendering render.start() ############################# ## 另一個寫法: ################ render.start() render.waitForFinished() img = render.renderedImage() img.save("C:/Maps/render.png", "png") ############################# -
假定我們有一個安排好了的layout(從Project > New Print Layout...開啟):
manager = QgsProject.instance().layoutManager() print(manager.printLayouts()) # get the info of the layout for layout in manager.printLayouts(): print(layout.name()) # export the layout layout = manager.layoutByName("thelayout") # the name obtained from layout.name() exporter = QgsLayoutExporter(layout) # a QgsLayoutExporter object instance exporter.exportToPdf("C:/Maps/layout1.pdf", QgsLayoutExporter.PdfExportSettings()) # or save the canvas as image directly iface.mapCanvas().saveAsImage("C:/Maps/layout1.png")-
第一行可以建立一個layout manager,若是試著印出來,可以得到一個包含QgsPrintLayout物件的list[<qgis._core.QgsPrintLayout object at 0x00000155DD9E80D0>]。
使用layout.name()可以得到layout的名稱。根據此名稱來得到layout。再根據此layout來建立QgsLayoutExporter物件exporter。呼叫exporter.exportToPdf()方法來建立PDF檔。
若只是要將canvas內容存成圖片,直接使用iface.mapCanvas().saveAsImage()方法。
Communicating with the user
與使用者互動的方式。- 顯示訊息:使用QgsMessageBar class。
# duration>optional>time last(5 seconds)
# 4 different levels>0.Info 1.Warning 2.Critical 3.Success
iface.messageBar().pushMessage("Hello, World!", level=Qgis.Critical, duration=5)
iface.messageBar().pushMessage("Warning!", level=1, duration=3)
我們還可以加入widget到message bar,e.g. button來顯示更多訊息。def showMessages(): print(f"More messages") widget = iface.messageBar().createMessage("Missing Layers", "Show Me") # create but not yet push button = QPushButton(widget) # In PyQt API, the QPushButton class object presents a button which when clicked can be programmed to invoke a certain function. button.setText("Click me") button.pressed.connect(showMessages) # 按下按鈕觸發showMessages函數 widget.layout().addWidget(button) # 將按鈕加入到layout(<PyQt5.QtWidgets.QHBoxLayout object at 0x00000211F2542700>) # 在message bar上顯示一個widget作為a message, Qgis.Warning:1 iface.messageBar().pushWidget(widget, Qgis.Warning) - 可以設計自己的視窗來顯示訊息。可能要先了解一些關於PyQt的用法。
class MyWin(QWidget): def __init__(self): QWidget.__init__(self) self.bar = QgsMessageBar() # 定義一個message bar # 設定bar的大小 self.bar.setSizePolicy( QSizePolicy.Minimum, QSizePolicy.Fixed ) # see help(QgsMessageBar().setSizePolicy) self.setLayout(QGridLayout()) self.layout().setContentsMargins(0, 0, 0, 0) # margin for left, top, right, buttom (for example, 10,10,10,10) ## The QDialogButtonBox class is a widget that presents buttons in a layout that is appropriate to the current widget style. ## 符合layout style的button self.buttonbox = QDialogButtonBox(QDialogButtonBox.Ok) # 定義一個OK button box self.buttonbox.accepted.connect(self.run) # 與self.run函數連結 self.layout().addWidget(self.buttonbox, 0, 1) # 將widget button box加入到layout self.layout().addWidget(self.bar, 0, 0) def run(self): self.bar.pushMessage("Hello", "World", level=Qgis.Info) win = MyWin() win.show() iface.messageBar().pushWidget(win) # 將視窗加入到上方的messageBar,若無此行則出現獨立視窗- 此例的bar是另一個QgsMessageBar,所以當我們加入iface.messageBar().pushWidget(win)此行後,會形成QgsMessageBar內還有一個QgsMessageBar的情況。
- 我們也可以使用一般的label與button來建立類似的效果。
class MyWin(QWidget):
    def __init__(self):
        QWidget.__init__(self)

        self.bar = QLabel("Default message")
        self.bar.setStyleSheet("border: 1px solid blue")
        self.bar.setSizePolicy( QSizePolicy.Minimum , QSizePolicy.Fixed )
        self.setLayout(QHBoxLayout())
        self.layout().setContentsMargins(0, 0, 0, 0)

        ## The QPushButton widget provides a command button.一般的button
        self.buttonbox = QPushButton("OK")
        self.buttonbox.setSizePolicy( QSizePolicy.Maximum , QSizePolicy.Maximum )
        self.buttonbox.clicked.connect(self.buttonText) # 與self.buttonText函數連結

        self.layout().addWidget(self.bar)
        self.layout().addWidget(self.buttonbox) # 將widget button box加入到layout

    def buttonText(self):
        """
        * Only used when the self.bar is a QLabel
        """
        self.bar.setText("Hello, World.")

win = MyWin()
win.show()
iface.messageBar().pushWidget(win) # 將視窗加入到上方的messageBar,若無此行則出現獨立視窗
- 使用progress bar。
import time ### does not need to import the following two if coding in the PYQGIS console ### #from qgis.PyQt.QtWidgets import QProgressBar #from qgis.PyQt.QtCore import * ## Creates message bar item widget containing a message text to be displayed on the bar. progressMessageBar = iface.messageBar().createMessage("Doing something...") bar = QProgressBar() # a progress bar bar.setMaximum(10) # set range bar.setAlignment(Qt.AlignLeft|Qt.AlignVCenter) # set alignment progressMessageBar.layout().addWidget(bar) # add bar to message item # Display a widget as a message on the bar, after hiding the currently visible one and putting it in a stack. iface.messageBar().pushWidget(progressMessageBar, Qgis.Info) # level: Info, Warning, Critical or Success for i in range(10): time.sleep(0.5) # wake up every 0.5 second bar.setValue(i + 1) # set up the value of the bar iface.messageBar().clearWidgets() # clear widgets on the messageBar- 做一點改良讓其與地圖元件結合。
import time
### does not need to import the following two if coding in the PYQGIS console ###
#from qgis.PyQt.QtWidgets import QProgressBar
#from qgis.PyQt.QtCore import *

vlayer = iface.activeLayer() # 需要先開啟一個圖層
count = vlayer.featureCount()
features = vlayer.getFeatures()

## Creates message bar item widget containing a message text to be displayed on the bar.
progressMessageBar = iface.messageBar().createMessage("Doing something...")
bar = QProgressBar() # a progress bar
bar.setMaximum(100) # set range
bar.setAlignment(Qt.AlignLeft|Qt.AlignVCenter) # set alignment
progressMessageBar.layout().addWidget(bar) # add bar to message item
# Display a widget as a message on the bar, after hiding the currently visible one and putting it in a stack.
iface.messageBar().pushWidget(progressMessageBar, Qgis.Info) # level: Info, Warning, Critical or Success

for i, feature in enumerate(features):
    time.sleep(0.1)
    percent = i / float(count) * 100
    bar.setValue(percent)
iface.messageBar().clearWidgets()
- 做一點改良讓其與地圖元件結合。
Network analysis
Network analysis可以用來建立網路並求解網路問題(目前只有Dijkstra’s algorithm)。所以主要使用步驟可分為- 建立網路(create graph from geodata (usually polyline vector layer))。
- 執行網路分析(run graph analysis)。
- 使用分析的結果(use analysis results (for example, visualize them))。
- 建立網路(Building a graph): 首先要建立道路方向性物件,使用QgsVectorLayerDirector這個class,
kh = iface.activeLayer() # 開啟一個line layer director = QgsVectorLayerDirector(kh, -1, '', '', '', QgsVectorLayerDirector.DirectionBoth)- QgsVectorLayerDirector的建構子如下:
director = QgsVectorLayerDirector(vectorLayer, directionFieldId, directDirectionValue, reverseDirectionValue, bothDirectionValue, defaultDirection)
此方式表示不使用方向性網路,所有路線預設為two-way。 對應的意義為:- vectorLayer : vector layer used to build the graph。
- directionFieldId : index of the attribute table field, where information about roads direction is stored. If -1, then don’t use this info at all. An integer.。
- directDirectionValue : field value for roads with direct direction (moving from first line point to last one). A string.。
- reverseDirectionValue : field value for roads with reverse direction (moving from last line point to first one). A string.。
- bothDirectionValue : field value for bidirectional roads (for such roads we can move from first point to last and from last to first). A string.。
- defaultDirection : default road direction. This value will be used for those roads where field directionFieldId is not set or has some value different from any of the three values specified above. Possible values are:QgsVectorLayerDirector.DirectionForward(One-way direct)、QgsVectorLayerDirector.DirectionBackward(One-way reverse)、QgsVectorLayerDirector.DirectionBoth(Two-way)。
- 所以如果我們的資料第index=5欄代表方向,可以使用如下方式:
director = QgsVectorLayerDirector(vectorLayer, 5, 'yes', '1', 'no', QgsVectorLayerDirector.DirectionBoth) - 接著我們可以使用strategy來加上線(edge)的屬性,例如路段速度。不過首先我們須有一個速度(Speed)的column。若沒有我們可以自己新增。使用如下指令:
Speed = QgsField('Speed', QVariant.Double) kh.dataProvider().addAttributes([Speed]) kh.updateFields() idx = kh.fields().indexOf('Speed') ## 此時idx應不為-1順帶一提,若是想要刪除欄位,使用如下指令:res = kh.dataProvider().deleteAttributes([6]) # The [0] represents the 1st field, so [1] is the 2nd field etc. To delete multiple fields, use the comma to separate. Eg. [0, 2, 4] kh.updateFields()當增加欄位後,還要加入value,合起來如下:kh = iface.activeLayer() # 開啟一個line layer Speed = QgsField('Speed', QVariant.Double) # 建立一個名為Speed的欄位,資料型態為Double kh.dataProvider().addAttributes([Speed]) # 將欄位加入layer kh kh.updateFields() # 更新欄位 idx = kh.fields().indexOf('Speed') ## 取得欄位speed的index, 此時idx應不為-1 if idx != -1: with edit(kh): # 修改kh layer for feature in kh.getFeatures(): # 取得每一個feature feature.setAttribute('Speed', 50.0) # 設定feature的屬性值Or feature['Speed'] = 50.0 kh.updateFeature(feature) # 更新feature現在可以建立strategy並將其加入:kh = iface.activeLayer() # 開啟一個line layer # The index of the field that contains information about the edge speed attributeId = 5 # Default speed value defaultValue = 50 # Conversion from speed to metric units ('1' means no conversion) toMetricFactor = 0.9 strategy = QgsNetworkSpeedStrategy(attributeId, defaultValue, toMetricFactor) director = QgsVectorLayerDirector(kh, -1, '', '', '', 3) # 建立director director.addStrategy(strategy) # 將strategy加入director ## 使用builder建立graph builder = QgsGraphBuilder(kh.crs()) - 使用class QgsGraphBuilder來建立graph,其中包含多個索引值。
class qgis.analysis.QgsGraphBuilder(crs: QgsCoordinateReferenceSystem, otfEnabled: bool = True, topologyTolerance: float = 0, ellipsoidID: str = '')- crs: coordinate reference system to use. Mandatory argument.
- otfEnabled: use “on the fly” reprojection or no. By default True (use OTF).
- topologyTolerance: topological tolerance. Default value is 0.
- ellipsoidID: ellipsoid to use. By default “WGS84”.
- 建立(build)網路後,我們即可得到graph物件(class QgsGraph)。
kh = iface.activeLayer() # 開啟一個line layer # The index of the field that contains information about the edge speed attributeId = 5 # Default speed value defaultValue = 50 # Conversion from speed to metric units ('1' means no conversion) toMetricFactor = 0.9 strategy = QgsNetworkSpeedStrategy(attributeId, defaultValue, toMetricFactor) director = QgsVectorLayerDirector(kh, -1, '', '', '', 3) # 建立director director.addStrategy(strategy) # 將strategy加入director ## 使用builder建立graph builder = QgsGraphBuilder(kh.crs()) ## 建立兩個點 startPoint = QgsPointXY(120.327596,22.733610) endPoint = QgsPointXY(120.265553,22.832600) # tiedPoints is a list with coordinates of “tied” points. # 將建立的點與builder綁定(tied) tiedPoints = director.makeGraph(builder, [startPoint, endPoint]) # 當build完成,我們即可得到graph(class QgsGraph) graph = builder.graph() - 有了graph instance,便可以使用其內建方法做一些操作。例如使用findVertex(self, pt: QgsPointXY) -> int來求得某點的index。
startId = graph.findVertex(tiedPoints[0])
endId = graph.findVertex(tiedPoints[1])
- QgsVectorLayerDirector的建構子如下:
- 接下來可以進行網路分析,下例為使用QgsGraphAnalyzer class中的dijkstra()方法來求解兩點間的最短路徑。
kh = iface.activeLayer() director = QgsVectorLayerDirector(kh, -1, '', '', '', QgsVectorLayerDirector.DirectionBoth) strategy = QgsNetworkDistanceStrategy() director.addStrategy(strategy) builder = QgsGraphBuilder(kh.crs()) startPoint = QgsPointXY(120.305533,22.674201) endPoint = QgsPointXY(120.310758,22.661744) ## 建立點圖層來顯示點 nodes = QgsVectorLayer("Point", "nodes", "memory") pr = nodes.dataProvider() pr.addAttributes([QgsField("name", QVariant.String), QgsField("Longitude", QVariant.Double), QgsField("Latitude", QVariant.Double)]) nodes.updateFields() # 更新欄位 f = QgsFeature() f.setGeometry(QgsGeometry.fromPointXY(startPoint)) # 點位置 f.setAttributes(["Start", 120.305533, 22.674201]) # 設定該點屬性 pr.addFeature(f) f.setGeometry(QgsGeometry.fromPointXY(endPoint)) f.setAttributes(["End", 120.310758, 22.661744]) # 設定該點屬性 pr.addFeature(f) # 將該點加入到layer的feature nodes.updateExtents() # 更新內容 QgsProject.instance().addMapLayer(nodes) # 將layer加入到canvas ## 建立點圖層來顯示點 tiedPoints = director.makeGraph(builder, [startPoint, endPoint]) #pStart = tiedPoint[0] graph = builder.graph() startId = graph.findVertex(tiedPoints[0]) endId = graph.findVertex(tiedPoints[1]) (tree, costs) = QgsGraphAnalyzer.dijkstra(graph, startId, 0) if tree[endId] == -1: raise Exception('No route!') # Total cost cost = costs[endId] # Add last point: 先加入end point,之後再依序往前加 route = [endPoint] # Iterate the graph while endId != startId: endId = graph.edge(tree[endId]).fromVertex() route.insert(0, graph.vertex(endId).point()) # 新的點加入到list的首位 route.insert(0, startPoint) # 最後加入start point # Display: 使用QgsRubberBand來繪製 rb = QgsRubberBand(iface.mapCanvas()) rb.setColor(Qt.red) for i, node in enumerate(route): rb.addPoint (node) # 將route內的每一點都加入到QgsRubberBand- 為了讓結果更明顯,上例中新增了一個點圖層來顯示開始與結束之點。並使用QgsRubberBand()來繪製路徑。
QgsRubberBand(mapCanvas: QgsMapCanvas, geometryType: QgsWkbTypes.GeometryType = QgsWkbTypes.LineGeometry)
- fromVertex():傳回graph中某一個edge的開始點。toVertex():傳回graph中某一個edge的結束點。其中的tree為一list,其中包含所有的shortest paths,若其中之值為-1則表示沒有進入的線(imcoming edge)。graph.edge(self, idx: int) -> QgsGraphEdge可以傳回一個edge物件。
- 為了讓結果更明顯,上例中新增了一個點圖層來顯示開始與結束之點。並使用QgsRubberBand()來繪製路徑。
- Areas of availability是另一個分析,可應用的例子例如有多大的範圍是距離車站十分鐘的路程?此問題依然可以使用QgsGraphAnalyzer class中的dijkstra() method。dijkstra()傳回兩個list,第一個是之前討論過的tree,第二個是cost,對應tree的路徑,如果沒有路徑連結某點,則其cost為DOUBLE_MAX。
kh = iface.activeLayer() # 需先開啟一layer director = QgsVectorLayerDirector(kh, -1, '', '', '', QgsVectorLayerDirector.DirectionBoth) strategy = QgsNetworkDistanceStrategy() director.addStrategy(strategy) builder = QgsGraphBuilder(kh.crs()) startPoint = QgsPointXY(120.305533,22.674201) delta = iface.mapCanvas().getCoordinateTransform().mapUnitsPerPixel() * 2 tiedPoints = director.makeGraph(builder, [startPoint]) graph = builder.graph() startId = graph.findVertex(tiedPoints[0]) (tree, costs) = QgsGraphAnalyzer.dijkstra(graph, startId, 0) upperBound = [] r = 3000.0 i = 0 tree.reverse() for i, cost in enumerate(costs): if cost < r and tree[i] != -1: upperBound.append(i) ## 建立點圖層來顯示點 nodes = QgsVectorLayer("Point", "nodes", "memory") pr = nodes.dataProvider() pr.addAttributes([QgsField("name", QVariant.String), QgsField("Longitude", QVariant.Double), QgsField("Latitude", QVariant.Double)]) nodes.updateFields() # 更新欄位 f = QgsFeature() f.setGeometry(QgsGeometry.fromPointXY(startPoint)) # 點位置 f.setAttributes(["Start Point", startPoint.x(), startPoint.y()]) # 設定該點屬性 pr.addFeature(f) for i in upperBound: centerPoint = graph.vertex(i).point() # f.setGeometry(QgsGeometry.fromPointXY(startPoint)) # 點位置 f.setGeometry(QgsGeometry.fromPointXY(centerPoint)) f.setAttributes([f"{i}", centerPoint.x(), centerPoint.y()]) # 設定該點屬性 pr.addFeature(f) nodes.renderer().symbol().setColor(QColor("red")) nodes.updateExtents() # 更新內容 QgsProject.instance().addMapLayer(nodes) # 將layer加入到canvas ## 建立點圖層來顯示點- 顯示的結果看起來是OK,不過似乎無法驗證其正確性。
- Exercise: Minimum Spanning Tree。練習求解MST。
- 首先在layer的Attribute Table內加入一個線段長度的欄位(Length),並且給值為每個線段的長度。做法與前例相同。
kh = iface.activeLayer() # 需先開啟一layer Length = QgsField('Length2', QVariant.Double) kh.dataProvider().addAttributes([Length]) kh.updateFields() idx = kh.fields().indexOf('Length2') ## 此時idx應不為-1 if idx != -1: d = QgsDistanceArea() d.setEllipsoid('WGS84') ## EPSG: 4326 with edit(kh): # 修改kh layer for feature in kh.getFeatures(): # 取得每一個feature lens = d.measureLength(feature.geometry()) ## unit: meter feature.setAttribute('Length2', lens) # 設定feature的屬性值Or feature['Length'] = lens kh.updateFeature(feature) # 更新feature - 選擇幾個點做為求解MST之題目,並將其儲存於檔案(mstNodes.txt),如下:

接下來先將其讀入然後顯示在新的圖層。class Node(object): def __init__(self, nid, lon, lat): self.nid = nid self.lon = lon self.lat = lat def __str__(self): return f"{self.nid}: {self.lon}, {self.lat}" __repr__ = __str__ def showNodes(): ## read the file and get all nodes nodes = [] with open("C:/Maps/mstNodes.txt") as f: for i, line in enumerate(f): if i==0: continue else: split = line.split() nodes.append(Node(int(split[0]), float(split[1]), float(split[2]))) print(nodes) ## Create a new layer mstNodes = QgsVectorLayer("Point", "mstNodes", "memory") pr = mstNodes.dataProvider() pr.addAttributes([QgsField("id", QVariant.Int), QgsField("Longitude", QVariant.Double), QgsField("Latitude", QVariant.Double)]) mstNodes.updateFields() # 更新欄位 f = QgsFeature() for n in nodes: point = QgsPointXY(n.lon, n.lat) # 建立點 f.setGeometry(QgsGeometry.fromPointXY(point)) # 設定點位置(geometry) f.setAttributes([n.nid, n.lon, n.lat]) # 設定該點屬性 pr.addFeature(f) # 將feature加入到dataProvider mstNodes.updateExtents() # 更新內容 QgsProject.instance().addMapLayer(mstNodes) # 將layer加入到canvas showNodes() - 看起來不錯,接下來計算任兩點間之最短路徑距離。
class MST(object): def __init__(self): kh = iface.activeLayer() ## read file and get all nodes self.nodes = [] # read files with open("C:/Maps/mstNodes.txt") as f: for i, line in enumerate(f): if i==0: continue else: split = line.split() # 直接加入QgsPointXY物件 self.nodes.append(QgsPointXY(float(split[1]), float(split[2]))) # print(self.nodes) self.sPath = [] ## 用來儲存任兩點間之shortest path self.costs = [] ## 用來儲存任兩點間之shortest path cost (length) ## 計算shortest path前之建立graph director = QgsVectorLayerDirector(kh, -1, '', '', '', QgsVectorLayerDirector.DirectionBoth) strategy = QgsNetworkDistanceStrategy() director.addStrategy(strategy) builder = QgsGraphBuilder(kh.crs()) self.tiedPoints = director.makeGraph(builder, self.nodes) self.graph = builder.graph() for i, n1 in enumerate(self.nodes): toNodes = [] cost = [] for j, n2 in enumerate(self.nodes): startId = self.graph.findVertex(self.tiedPoints[i]) endId = self.graph.findVertex(self.tiedPoints[j]) r, c = self.shortest(self.tiedPoints[i], startId, self.tiedPoints[j], endId) toNodes.append(r) cost.append(c) self.sPath.append(toNodes) self.costs.append(cost) # self.drawPath(2,5) # print(self.costs[2][5]) for i in range(len(self.nodes)): for j in range(len(self.nodes)): self.drawPath(i,j) print(self.costs[i][j]) def shortest(self, startPoint, startId, endPoint, endId): # print(f"{startPoint}, {endPoint}") (tree, costs) = QgsGraphAnalyzer.dijkstra(self.graph, startId, 0) if tree[endId] == -1: return (None, None) # raise Exception('No route!') ## will interrupt the program route = [endPoint] ## the route of the shortest path cost = costs[endId] ## cost of the shortest path # print(f"cost = {cost}") # Iterate the graph while endId != startId: endId = self.graph.edge(tree[endId]).fromVertex() route.insert(0, self.graph.vertex(endId).point()) # 新的點加入到list的首位 route.insert(0, startPoint) # 最後加入start point return (route, cost) def drawPath(self, startIndex, endIndex, color = Qt.blue): route = self.sPath[startIndex][endIndex] if route is not None: rb = QgsRubberBand(iface.mapCanvas()) rb.setColor(color) for i, node in enumerate(route): rb.addPoint (node) # 將route內的每一點都加入到QgsRubberBand else: print(route) mst = MST() - 若修改程式碼,可能需要重開程式或是重開機再執行。
- 接下來使用costs來計算Minimum Spanning Tree。
class MST(object):
    def __init__(self):
        kh = iface.activeLayer()
        ## read file and get all nodes
        self.nodes = []
        # read files
        with open("C:/Maps/mstNodes.txt") as f:
            for i, line in enumerate(f):
                if i==0:
                    continue
                else:
                    split = line.split()
                    # 直接加入QgsPointXY物件
                    self.nodes.append(QgsPointXY(float(split[1]), float(split[2])))

#        print(self.nodes)
        self.sPath = [] ## 用來儲存任兩點間之shortest path
        self.costs = [] ## 用來儲存任兩點間之shortest path cost (length)

        ## 計算shortest path前之建立graph
        director = QgsVectorLayerDirector(kh, -1, '', '', '', QgsVectorLayerDirector.DirectionBoth)
        strategy = QgsNetworkDistanceStrategy()
        director.addStrategy(strategy)
        builder = QgsGraphBuilder(kh.crs())

        self.tiedPoints = director.makeGraph(builder, self.nodes)
        self.graph = builder.graph()

        for i, n1 in enumerate(self.nodes):
            toNodes = []
            cost = []
            for j, n2 in enumerate(self.nodes):
                startId = self.graph.findVertex(self.tiedPoints[i])
                endId = self.graph.findVertex(self.tiedPoints[j])
                r, c = self.shortest(self.tiedPoints[i], startId, self.tiedPoints[j], endId)
                toNodes.append(r)
                cost.append(c)

            self.sPath.append(toNodes)
            self.costs.append(cost)

        ## for mininum spanning tree
        self.msTree = []
        self.inTree = [0]
        self.notInTree = [i for i in range(1,11)]
#        print(self.notInTree)
        for round in range(10):
            self.mininumSpanningTree()

        for branch in self.msTree:
            fn, tn = branch
            self.drawPath(fn, tn)

    def shortest(self, startPoint, startId, endPoint, endId):
#        print(f"{startPoint}, {endPoint}")
        (tree, costs) = QgsGraphAnalyzer.dijkstra(self.graph, startId, 0)
        if tree[endId] == -1:
            return (None, None)
#            raise Exception('No route!') ## will interrupt the program

        route = [endPoint] ## the route of the shortest path
        cost = costs[endId] ## cost of the shortest path
#        print(f"cost = {cost}")
        # Iterate the graph
        while endId != startId:
            endId = self.graph.edge(tree[endId]).fromVertex()
            route.insert(0, self.graph.vertex(endId).point()) # 新的點加入到list的首位
        route.insert(0, startPoint) # 最後加入start point

        return (route, cost)

    def drawPath(self, startIndex, endIndex, color = Qt.blue):
        route = self.sPath[startIndex][endIndex]
        if route is not None:
            rb = QgsRubberBand(iface.mapCanvas())
            rb.setColor(color)
            for i, node in enumerate(route):
                rb.addPoint (node) # 將route內的每一點都加入到QgsRubberBand
        else:
            print(route)

    def mininumSpanningTree(self):
        fromnode = 0
        tonode = 0
        minLength = 999999
        for i in self.inTree:
            for j in self.notInTree:
                if self.costs[i][j] is None:
#                    print(f"j: {j}")
                    continue
                if self.costs[i][j] < minLength:
                    fromnode = i
                    tonode = j
                    minLength = self.costs[i][j]

#        print(f"{self.notInTree} >> {fromnode}, {tonode} << {minLength}")
        self.msTree.append((fromnode, tonode))
        self.inTree.append(tonode)
        if tonode in self.notInTree:
            self.notInTree.remove(tonode)
#        return (fromnode, tonode)

mst = MST()
- 首先在layer的Attribute Table內加入一個線段長度的欄位(Length),並且給值為每個線段的長度。做法與前例相同。
Processing Tools
使用Processing Tools來協助。首先看以下的code:uri = "C:/Maps/packages/natural_earth_vector.gpkg|layername=ne_110m_populated_places"
result = processing.run("native:buffer",
{'INPUT':uri,'DISTANCE':10,'SEGMENTS':5,'END_CAP_STYLE':0,'JOIN_STYLE':0,'MITER_LIMIT':2,
'DISSOLVE':False,'OUTPUT':'memory:'})
QgsProject.instance().addMapLayer(result['OUTPUT'])
buffer方法定義: This algorithm computes a buffer area for all the features in an input layer, using a fixed or dynamic distance.。
processing.run()需求兩個參數,第一個是演算法的名稱(也可使用qgis:buffer),第二個是演算法的設定參數(為一個dict,可使用processing.algorithmHelp("native:buffer")語法取得各項的內容說明。)。回傳的result也是一個dict,所以使用result['OUTPUT']來取得其值。
可以直接使用runAndLoadResults(),便不需要
uri = "C:/Maps/packages/natural_earth_vector.gpkg|layername=ne_110m_populated_places"
result = processing.runAndLoadResults("native:buffer",
    {'INPUT':uri,'DISTANCE':10,'SEGMENTS':5,'END_CAP_STYLE':0,'JOIN_STYLE':0,'MITER_LIMIT':2,
    'DISSOLVE':False,'OUTPUT':'memory:'})
建立對話視窗:
uri = "C:/Maps/packages/natural_earth_vector.gpkg|layername=ne_110m_populated_places"
result = processing.createAlgorithmDialog("native:buffer",
    {'INPUT':uri,'DISTANCE':10,'SEGMENTS':5,'END_CAP_STYLE':0,'JOIN_STYLE':0,'MITER_LIMIT':2,
    'DISSOLVE':False,'OUTPUT':'memory:'})
result.show()
-
改為processing.createAlgorithmDialog()可以建立對話視窗。使用result.show()語法開啟。
在視窗中可以進行修改,或直接按run執行。
練習看看最短路徑的做法:
uri = "C:\Maps\KHRoads.shp"
result = processing.run("qgis:shortestpathpointtopoint",
    {'INPUT':uri, 'START_POINT':"120.28999,22.82482", 'END_POINT':"120.34166, 22.82857", 'OUTPUT': "memory:"})
QgsProject.instance().addMapLayer(result['OUTPUT'])
也可以使用對話視窗:
uri = "C:\Maps\KHRoads.shp"
iface.addVectorLayer(uri, "khroads", "ogr")
result = processing.createAlgorithmDialog("qgis:shortestpathpointtopoint",
    {'INPUT':uri, 'START_POINT':"120.28999,22.82482", 'END_POINT':"120.34166, 22.82857", 'OUTPUT': "memory:"})
result.show()
加入開啟地圖,不然地圖無法顯示。
Open Street Map
是開放軟體,可以使用Leaflet來操控。我們可以下載Leaflet來使用,也可以直接使用在CDN的Hosted Version,在download頁面可以找到最新版。將其複製,然後貼到html檔案的head內。如下:<link rel="stylesheet" href="https://unpkg.com/leaflet@1.8.0/dist/leaflet.css" integrity="sha512-hoalWLoI8r4UszCkZ5kL8vayOGVae1oxXe/2A4AO6J9+580uKHDO3JdHb7NzwwzK5xr/Fs0W40kiNHxM9vyTtQ==" crossorigin="" />
<script src="https://unpkg.com/leaflet@1.8.0/dist/leaflet.js" integrity="sha512-BB3hKbKWOc9Ez/TAwyWxNXeoV9c1v6FIeYiBieIWkpLjauysF18NzgR1MBNBXf8/KABdlkX68nAhlwcDFLGPCQ==" crossorigin=""></script>
接下來在body內建立一個放置地圖的地方,如下:
<div id="mapid"></div>
加上相關的CSS讓其顯示。
body {
    margin: 0;
    padding: 0;
}
#mapid {
    width: 100vw;
    height: 100vh;
}
接下來加上如下的javascripe code即可。
let map = L.map('mapid', {
    center: [22.757296287028296, 120.3376949843434],
    zoom: 17
});

L.tileLayer('https://{s}.tile.openstreetmap.org/{z}/{x}/{y}.png', {
    attribution: '© <a href="https://www.openstreetmap.org/copyright">OpenStreetMap</a> contributors'
}).addTo(map);
然後在瀏覽器應該就可以看到地圖。
- 程式碼中的L代表整個Leaflet的框架,在其map()內,第一個參數是地圖顯示的元件id,第二個參數是個物件,包含中心位置(center:經緯度)以及縮放比例(數字越大表示zoom out)。也可以寫成這樣:
let map = L.map('mapid').setView([22.757296287028296, 120.3376949843434], 17); - 至於tileLayer()則是設定圖層,設定好之後使用addTo()方法將其加入至地圖中。而tileLayer()的第一個參數為顯示之圖,第二個參數為物件,包含attribution以及其他屬性(例如maxZoom、id、tileSize、zoomOffset、accessToken等,原則上應使用預設值即可)。
-
使用以下函數取得基本資訊:
-
map.getCenter():取得地圖目前中心點座標。
map.getZoom():取得地圖目前縮放等級。
map.getBounds():取得地圖目前邊角(左上與右下)資訊。
map.getMinZoom():取得地圖最小縮放等級。
map.getMaxZoom():取得地圖最大縮放等級。
Marker
我們可以在地圖上加上標記,使用的語法如下:- 加入基本marker。
let nkust = L.marker([22.757296287028296, 120.3376949843434]).addTo(map);可以加入多個marker。 - 加入圓形:
let ncku = L.circle([22.999279649452173, 120.22088247962533], {
    color: 'red',
    fillColor: '#fa0f3f',
    fillOpacity: 0.5,
    radius: 20
}).addTo(map);
控制radius來改變大小。 - 加入多邊形:
let nkustFirst = L.polygon([ [22.759374730849625, 120.34137057338], [22.75810406415603, 120.33289872497483], [22.75582154059091, 120.32516688742429], [22.75311540653696, 120.325268957887], [22.75288008799885, 120.32764209614507], [22.75174247839428, 120.32767724801658], [22.751860138693743, 120.33369940531665], [22.755648746171385, 120.33665944873533], [22.756684123722078, 120.34071674962819] // 最後會直接連回第一點 ]).addTo(map); - Marker可以加入屬性,例如可拖曳(draggable):
let nkust = L.marker([22.757296287028296, 120.3376949843434], { draggable: true, // 設定為可拖曳 autoPan: true, // 設定地圖自動跟著marker移動 autoPanPadding: [150, 150], // 設定marker靠近邊界多少距離開始移動 autoPanSpeed: 20 // 設定移動速度 }).addTo(map); - 使用自訂圖片:
let airportIcon = L.icon({ iconUrl: 'airplane.png', shadowUrl: '', // 如果有shadow的圖 iconSize: [30, 30], // size of the icon shadowSize: [50, 64], // size of the shadow iconAnchor: [0, 0], // point of the icon which will correspond to marker's location shadowAnchor: [4, 62], // the same for the shadow popupAnchor: [0, 0] // point from which the popup should open relative to the iconAnchor }); L.marker([22.575974, 120.344131], { icon: airportIcon, draggable: true }).addTo(map); - 使用popup:
nkust.bindPopup("高科大 第一校區").openPopup();
bindPopup()的輸入參數可以使用HTML(+CSS)語法。如果沒有使用openPopup()來直接顯示,可以點擊marker便會出現popup。也可以隨意找個地方建立popup。
let popup = L.popup()
    .setLatLng([22.759374730849625, 120.34237057338])
    .setContent("A standalone popup.")
    .openOn(map);
若是有多個icon且共享多個設定,可以將icon設計為物件,如下:
var MyIcon = L.Icon.extend({
    options: {
        shadowUrl: '',
        iconSize:     [30, 30],
        shadowSize:   [50, 64],
        iconAnchor:   [0, 0],
        shadowAnchor: [4, 62],
        popupAnchor:  [0, 0]
    }
});

let KHairport = new MyIcon({iconUrl: 'airplane.png'});
let DYairport = new MyIcon({iconUrl: 'airplane1.png'});
let SSairport = new MyIcon({iconUrl: 'airplane2.png'});

L.marker([22.575974, 120.344131], {icon: KHairport}).addTo(map);
L.marker([25.078369, 121.234174], {icon: DYairport}).addTo(map);
L.marker([25.064133, 121.551661], {icon: SSairport}).addTo(map);
也可以使用class。
class MyIcon extends L.icon{
    constructor(iconUrl){
        super();
        this.options = {
            iconUrl: iconUrl,
            shadowUrl: '',
            iconSize:     [30, 30],
            shadowSize:   [50, 64],
            iconAnchor:   [0, 0],
            shadowAnchor: [4, 62],
            popupAnchor:  [0, 0]
        }
    }
}

let KHairport = new MyIcon('airplane.png');
let DYairport = new MyIcon('airplane1.png');
let SSairport = new MyIcon('airplane2.png');

L.marker([22.575974, 120.344131], {icon: KHairport}).addTo(map);
L.marker([25.078369, 121.234174], {icon: DYairport}).addTo(map);
L.marker([25.064133, 121.551661], {icon: SSairport}).addTo(map);
Layer
之前介紹的Marker與Popup屬於UI Layers,而之前顯示的地圖屬於raster layer。若想顯示不同型態外觀的地圖,可至Leaflet providers網站選取想要的style。或參考官網之Basemap Providers。Vector Layer則包含點線面等元件。
- Circle Marker:在Marker介紹過的。除了繼承的方法,另有toGeoJSON()、setLatLng()、getLatLng()、setRadius()、getRadius()等方法可使用。例如:
let circleMarker = L.circle([22.999279649452173, 120.22088247962533], { color: 'red', fillColor: '#fa0f3f', fillOpacity: 0.5, radius: 20 }).addTo(map); circleMarker.setLatLng([22, 120]); circleMarker.setRadius(100); console.log(circleMarker.toGeoJSON()); console.log(circleMarker.getRadius()); console.log(circleMarker.getLatLng()); - PolyLine:
- PolyLine:
- PolyLine:
- PolyLine:
- PolyLine:
- PolyLine:
- PolyLine:
Event
也可以進行事件處理,例如:map.on('click', (e)=>{console.log(e.latlng)});
注意若是點擊在前述有popup的marker上,會出現popup而不會得到座標。不過倒是可以使用popup來顯示座標,如下:
map.on('click', (e)=>{
    L.popup().setLatLng(e.latlng).setContent(e.latlng.toString()).openOn(map);
});
Routing
欲在地圖上繪製最短路徑路線並計算路線長度,可以使用套件(Plugin),此處介紹Leaflet Routing Machine。做法如下,首先在head加上leaflet-routing-machine.css與leaflet-routing-machine.js:<link rel="stylesheet" href="https://unpkg.com/leaflet-routing-machine@latest/dist/leaflet-routing-machine.css" />
<script src="https://unpkg.com/leaflet-routing-machine@latest/dist/leaflet-routing-machine.js"></script>
若想要下載亦可,方式詳見官網。接下來在javascript內加上以下程式碼即可。
L.Routing.control({
waypoints: [
    L.latLng(22.757296287028296, 120.3376949843434),
    L.latLng(22.795367, 120.337632)
]
}).addTo(map);
只要給兩地的經緯度即可計算並顯示。做個routing的例子:
let map = L.map('mapid').setView([22.757296287028296, 120.3376949843434], 12);
L.tileLayer('https://{s}.tile.openstreetmap.org/{z}/{x}/{y}.png', {
    attribution: '© <a href="https://www.openstreetmap.org/copyright">OpenStreetMap</a> contributors'
}).addTo(map);


L.Routing.control({
    waypoints: [
        L.latLng(22.757296287028296, 120.3376949843434),
        L.latLng(22.755367, 120.297632),
        L.latLng(22.727087, 120.310142),
        L.latLng(22.744107, 120.335462),
        L.latLng(22.757296287028296, 120.3376949843434)
    ]
}).addTo(map);
再試一個可以自訂marker與popup的例子:
let map = L.map('mapid').setView([22.757296287028296, 120.3376949843434], 12);
L.tileLayer('https://{s}.tile.openstreetmap.org/{z}/{x}/{y}.png', {
    attribution: '© <a href="https://www.openstreetmap.org/copyright">OpenStreetMap</a> contributors'
}).addTo(map);

L.Routing.control({
    waypoints: [
        L.latLng(22.66863, 120.30982),
        L.latLng(22.64067, 120.308404),
        L.latLng(22.757296287028296, 120.3376949843434)
    ],
    routeWhileDragging: true,
    lineOptions: { // 修改線型
        styles: [{ color: 'green', opacity: 1, weight: 5 }]
    },

    createMarker: function (i, waypoint, n) { // 自訂marker

        let marker = L.marker(waypoint.latLng, {
            draggable: true, // 可拖曳
            bounceOnAdd: false,
            bounceOnAddOptions: {
                duration: 1000,
                height: 800,
                function() {
                    (bindPopup(popup).openOn(map))
                }
            },
            icon: L.icon({
                iconUrl: 'airplane.png',
                iconSize: [30, 30],
                iconAnchor: [15, 15],
                popupAnchor: [0, 0],
                shadowUrl: '',
                shadowSize: [0, 0],
                shadowAnchor: [0, 0]
            })

        });
        //建立popup
        let popup = L.popup().setContent(`<span style="font-weight: bolder; color: blue;">${i}</span>:${waypoint.latLng}->${n}`);

        return marker.bindPopup(popup);
    }
}).addTo(map);
